Gambar Logo Tajuk

Market News & Analysis.

Catch up on the latest in the market and get the latest market reviews.
USD Hits 30-Year High in 2024: What Does It Mean for the Markets? Featuring rising financial trends, stock market analysis, and the impact of a strong dollar.
Forex 8 min read

USD hits 30-year high in 2024: What does it mean for the markets

26 Jun, 2026
A man with text of EUR/USD levels to watch on the side, illustrating a trader's guide to today's Federal Funds Rate decision
Daily Forex Analysis 8 min read

A Traders Guide To Today's Federal Funds Rate Decision

12 Jun, 2025
A financial analysis graphic titled "Forex Trading Week Ahead Analysis: 10th June" by Blueberry, featuring a blueberry illustration and the date June 10, 2024, illustrating key forex trading opportunities for the week.
Week Ahead 8 min read

Forex Trading Week Ahead Analysis: 10th June

09 Jun, 2025
Two hands pointing at a laptop screen displaying a complex financial chart with lines, candles, and numbers, illustrating 5 signs that indicate it’s time to change your trading strategy
Trading Strategies 8 min read

5 Signs That Indicate It’s Time to Change Your Trading Strategy

05 Jun, 2025
trader reacting to sudden forex market crash with sharp candlestick drop on trading platform
Trading Strategies 4 min read

How to Protect Yourself From Market Reversals?

05 Mar, 2025
a golden dollar sign on a distressed American flag, symbolizing economic uncertainty.
Economic Indicator 7 min read

US Inflation Outlook for 2025

05 Mar, 2025
Wooden letters spelling 'NFP' placed on an American flag, symbolizing the U.S. Non-Farm Payroll report, a key event in the Forex Week Ahead Analysis: 3rd March.
Week Ahead 5 min read

Forex Week Ahead Analysis: 3rd March

03 Mar, 2025
Flags of the European Central Bank (ECB) and the European Union waving against a blue sky. The ECB's rate decision significantly impacts forex markets and the Euro's value.
Economic Indicator 5 min read

How to Trade the ECB Rate Decision

03 Mar, 2025
a3D digital representation of the Euro currency constructed from blue illuminated cubes
Week Ahead 5 min read

Forex Week Ahead Analysis: 24th February

24 Feb, 2025
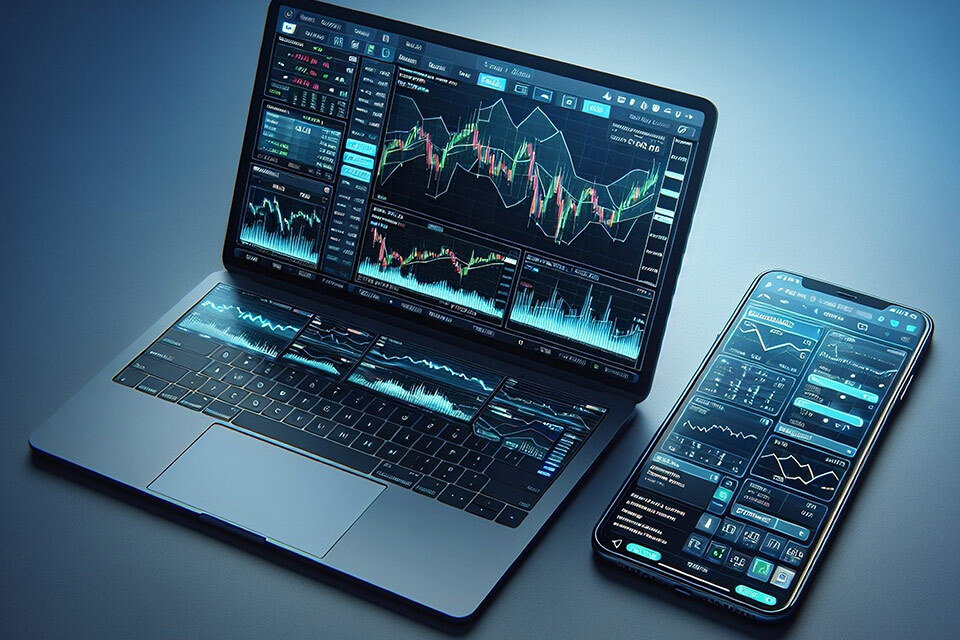
a laptop and smartphone displaying advanced trading charts and  indicators
MetaTrader 8 min read

How to Subscribe to Trading Signals on MetaTrader

20 Feb, 2025
a digitally rendered gold coin featuring the face of Donald Trump
Cryptocurrencies 8 min read

Guide to Trump Coin: Everything Traders Must Know

19 Feb, 2025
two metallic coins featuring the Australian and New Zealand flags
Week Ahead 8 min read

Forex Week Ahead Analysis: 17th February

17 Feb, 2025
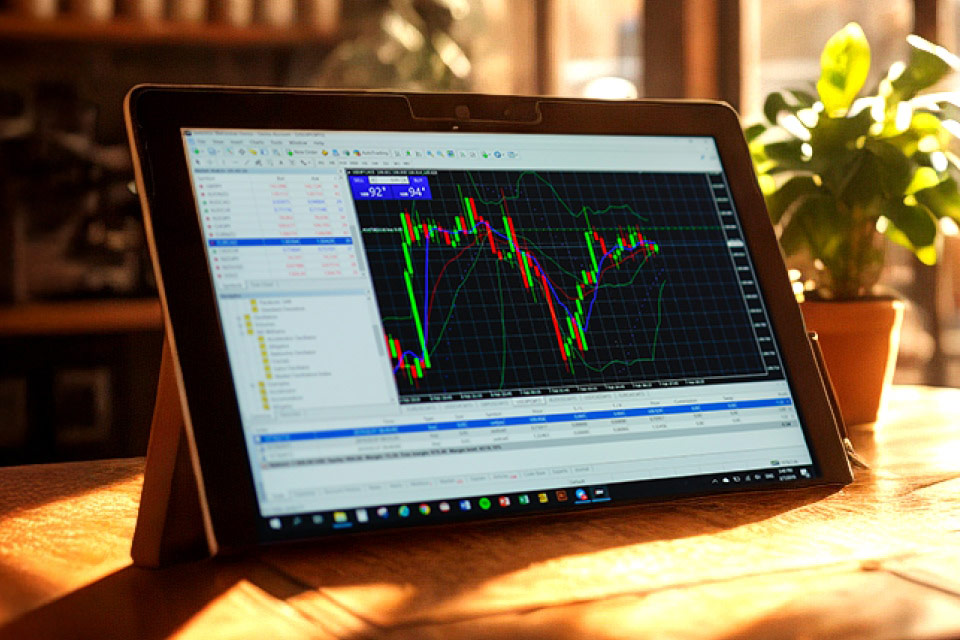
tablet displaying technical analysis charts on MT5 trading platform
MetaTrader 6 min read

Advanced Technical Analysis with MT5 Indicators

14 Feb, 2025
When to trade a forex cross pair? Metallic currency symbols (€, $, ¥, £) placed on a wooden table in a modern office, symbolizing forex trading opportunities beyond major currency pairs.
Forex 8 min read

When to Trade a Forex Cross Pair?

13 Feb, 2025
golden GDP letters surrounded by stacks of coins,
Economic Indicator 8 min read

How Can Traders Use GDP to Find Opportunities?

11 Feb, 2025
an upward trending chart displayed on a laptop screen
Trading Strategies 4 min read

Can Positive Reevaluation Improve Your Trading Performance?

10 Feb, 2025
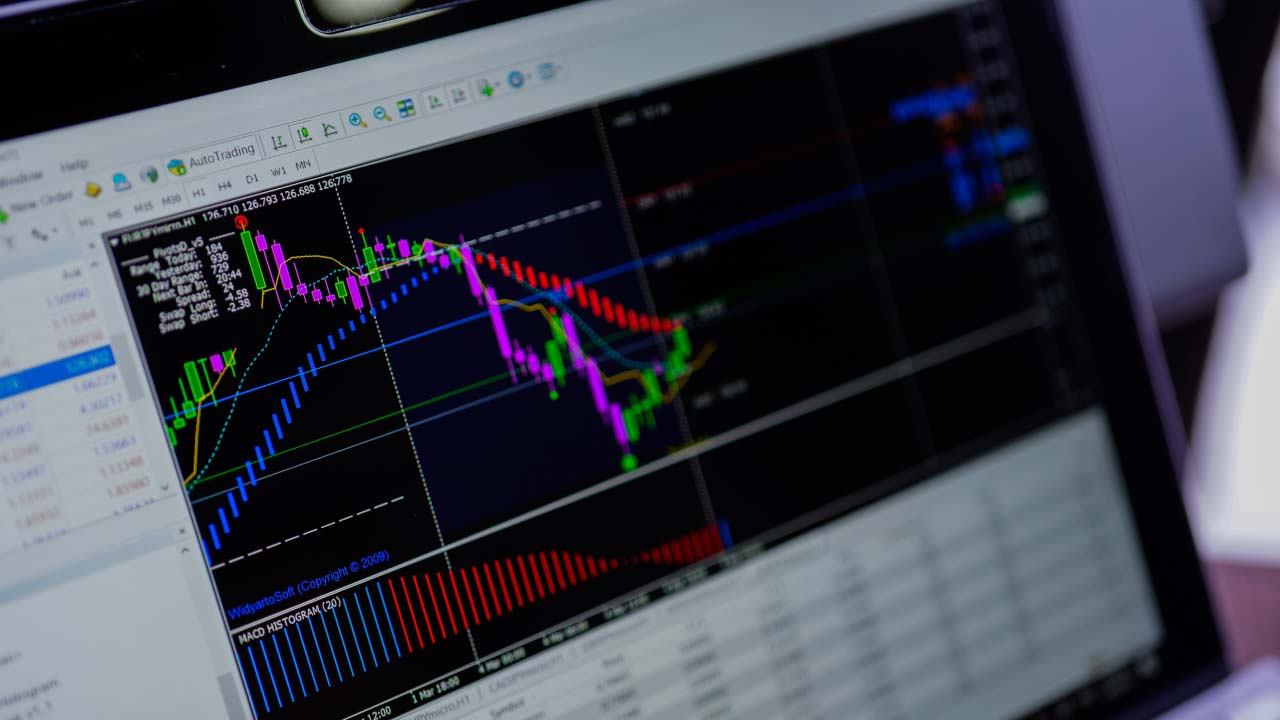
MetaTrader 7 min read

Can You Add Scripts to MetaTrader 4?

10 Feb, 2025
A financial growth concept with ascending stacked cubes and gold coins, illustrating Forex Week Ahead Analysis: 10th February.
Week Ahead 8 min read

Forex Week Ahead Analysis: 10th February

10 Feb, 2025
a futuristic descending bar chart with one highlighted red bar
Trading Strategies 8 min read

How to Avoid Being Influenced by Recency Bias

08 Feb, 2025
a stylized blue whale logo with a futuristic design
Economic Indicator 5 min read

DeepSeek's Disruption of Global Financial Markets: What You Need to Know

07 Feb, 2025
Stacked coins decreasing in height with a downward blue arrow, illustrating why you should set (and stick to) a maximum trading loss.
Trading Strategies 8 min read

Why You Should Set (And Stick To) A Maximum Trading Loss

07 Feb, 2025
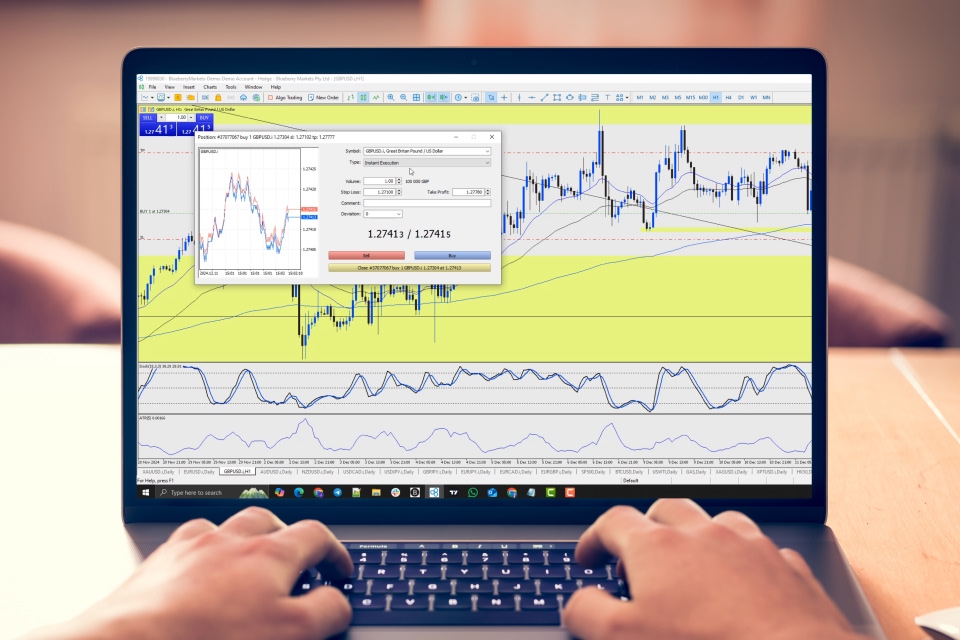
a trader adjusting trade volume settings on the MetaTrader platform
MetaTrader 7 min read

How to Change The Volume of a Trade in MetaTrader

06 Feb, 2025
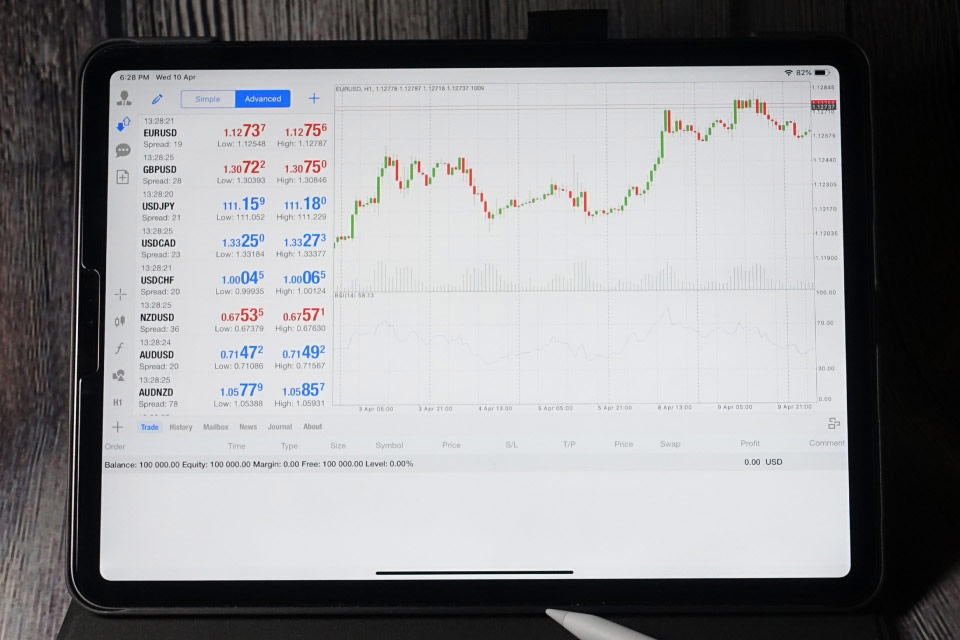
trading interface on MetaTrader 5 (MT5) displayed on a tablet
MetaTrader 6 min read

How To Create Templates In MT5

05 Feb, 2025
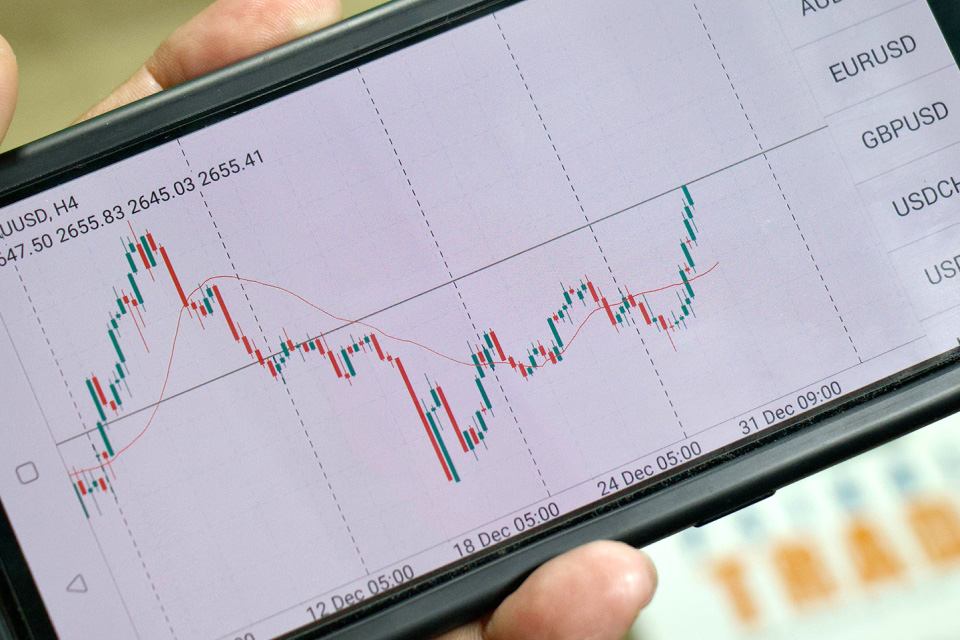
Mastering Chart Types in MetaTrader 5 – A trader analyzing candlestick patterns and price movements on a smartphone trading app.
MetaTrader 8 min read

Mastering Chart Types in MetaTrader 5

04 Feb, 2025
Trading Opportunities in the MSCI Emerging Markets Index, illustrated by a magnified view of the MSCI website.
Economic Indicator 7 min read

Trading Opportunities in the MSCI Emerging Markets Index

04 Feb, 2025
Scissors placed on US dollar bills, symbolizing interest rate cuts, illustrating the concept of what happens when a central bank cuts interest rates.
Economic Indicator 7 min read

What Happens When a Central Bank Cuts Interest Rates?

04 Feb, 2025
trading workstation with multiple monitors displaying financial charts
Forex 6 min read

A Comprehensive Guide to Using Demo Accounts + Top Tips

03 Feb, 2025
US job market report with an American flag in the background
Week Ahead 5 min read

Forex Week Ahead Analysis: 3rd February

03 Feb, 2025
Flag of the European Central Bank, illustrating why the European Central Bank cut interest rates again.
Economic Indicator 5 min read

Why European Central Bank Cut Interest Rates Again?

21 Jan, 2025
Wooden percentage symbol placed on a stack of coins, illustrating Fed cuts interest rates and the debate between recession or a soft landing
Economic Indicator 8 min read

Fed Cuts Interest Rates: Recession or Just a Soft Landing?

20 Jan, 2025
Stacked cardboard boxes with shopping cart icons placed on a US dollar bill
Week Ahead 5 min read

Forex Week Ahead Analysis: 20th January

20 Jan, 2025
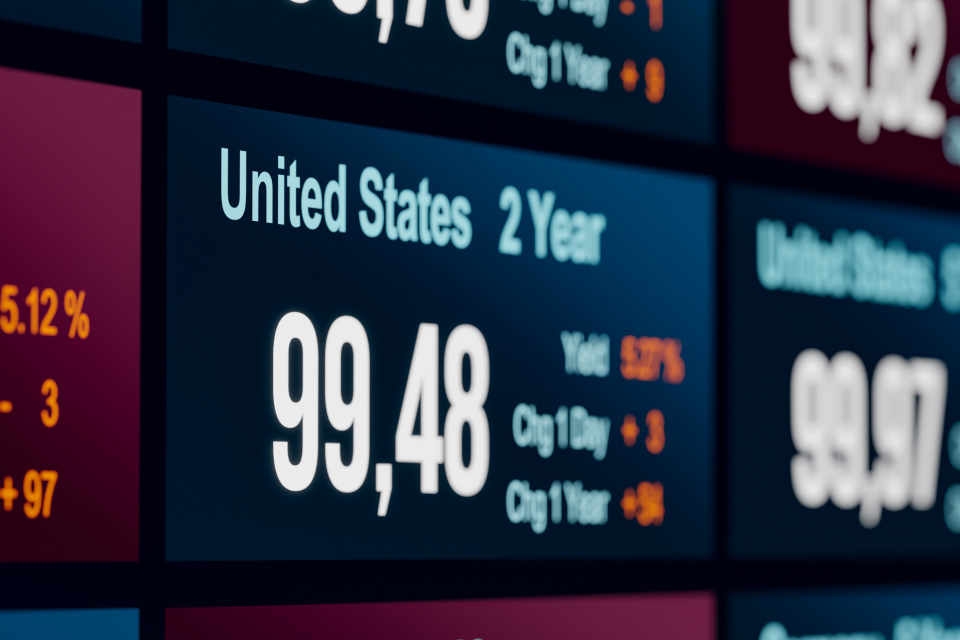
Treasury Bonds vs. Treasury Notes vs. Treasury Bills, illustrated by a digital display board showcasing U.S. Treasury yields.
Trading Strategies 8 min read

Treasury Bonds vs. Treasury Notes vs. Treasury Bills

17 Jan, 2025
What is WTI Crude Oil? A financial chart displaying price fluctuations of WTI crude oil, with colorful trend lines and indicators representing market movements.
Commodities 8 min read

What is WTI Crude Oil: A Beginner’s Guide to Understanding the Benchmark

14 Jan, 2025

barrels of oil placed on a digital stock market background
Economic Indicator 8 min read

Impact of Fed Rate Cuts on Oil Prices

13 Jan, 2025
Magnifying glass highlighting the phrase 'JOB MARKET' over a background of rising red and black trend lines on a graph, illustrating Forex Week Ahead Analysis: 13th January.
Week Ahead 5 min read

Forex Week Ahead Analysis: 13th January

12 Jan, 2025
Stacked coins with a percentage symbol icon, symbolizing interest rates, illustrating where interest rates might go in 2025.
Economic Indicator 8 min read

Where Interest Rates Might Go In 2025?

09 Jan, 2025
Top Cryptocurrency Forecasts for 2025, illustrated by stacks of Bitcoin, Ethereum, and Ripple coins.
Cryptocurrencies 8 min read

Top Cryptocurrency Forecasts for 2025

08 Jan, 2025
Bitcoin Price Prediction for 2025: A dynamic image of golden Bitcoin coins in motion, symbolizing the volatility and future potential of cryptocurrency.
Cryptocurrencies 8 min read

Bitcoin Price Prediction For 2025: What to Expect?

07 Jan, 2025
An image of 2025 with some metallic candlesticks, illustrating forex markets in 2025 and top predictions
Forex 8 min read

Forex Markets in 2025: Top Predictions

07 Jan, 2025
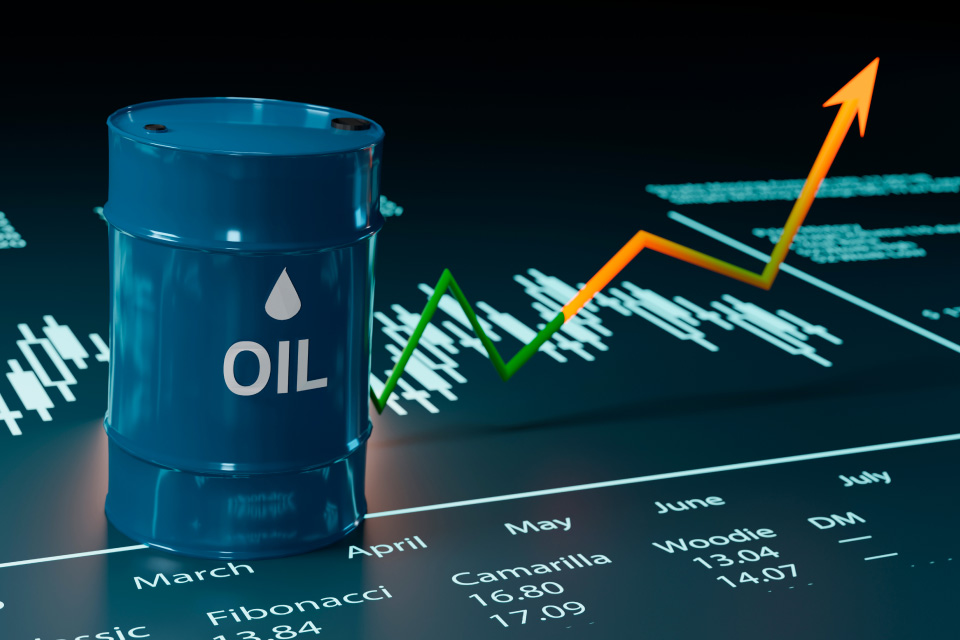
Oil Prices in 2025: What Do The Experts Say?, illustrated by a graphic featuring fluctuating oil prices and expert predictions.
Commodities 5 min read

Oil Prices in 2025: What Do The Experts Say?

07 Jan, 2025
A collection of emerging market currencies with financial charts, illustrating emerging market currencies to watch
Forex 8 min read

Emerging Market Currencies to Watch

26 Dec, 2024
A trader wearing a Santa hat analyzing a forex chart on a laptop by a cozy fireplace with Christmas decorations. Assessing forex market activity during the holiday season.
Forex 8 min read

Should You Trade Forex During Christmas and New Year?

24 Dec, 2024
image of rising interest rates represented as a staircase
Week Ahead 5 min read

Forex Week Ahead Analysis: 9th December

19 Dec, 2024
Stack of shiny gold bars with a large gold bullion in the foreground, illustrating the question: will gold climb higher in 2025?
Commodities 6 min read

Will Gold Climb Higher in 2025?

19 Dec, 2024
a 3D image of grey stacked coins with a large circular arrow
Week Ahead 5 min read

Forex Week Ahead Analysis: 16th December

18 Dec, 2024
3D bar chart in red showing a downward trend with a red arrow pointing downwards, symbolizing financial decline or recession.
Economic Indicator 5 min read

Is The US Recession Coming in 2025?

17 Dec, 2024
Is the BOJ Interest Rate Hike Coming Soon?
Economic Indicator 8 min read

Is the BOJ Interest Rate Hike Coming Soon?

16 Dec, 2024
Stacked metallic blue trading cards with floating coins, illustrating the concept of what corporate bonds are.
Economic Indicator 7 min read

What are Corporate Bonds?

12 Dec, 2024
A metallic keyboard key labeled "FTSE 100," symbolizing market trends and the future outlook of the UK stock index.
Economic Indicator 5 min read

What is next for FTSE 100?

11 Dec, 2024
a 3D illustration of copper elements including cylindrical bars and stacked coins arranged on stone-like pedestals
Commodities 5 min read

Copper Trading: Capitalizing on Global Demand

09 Dec, 2024
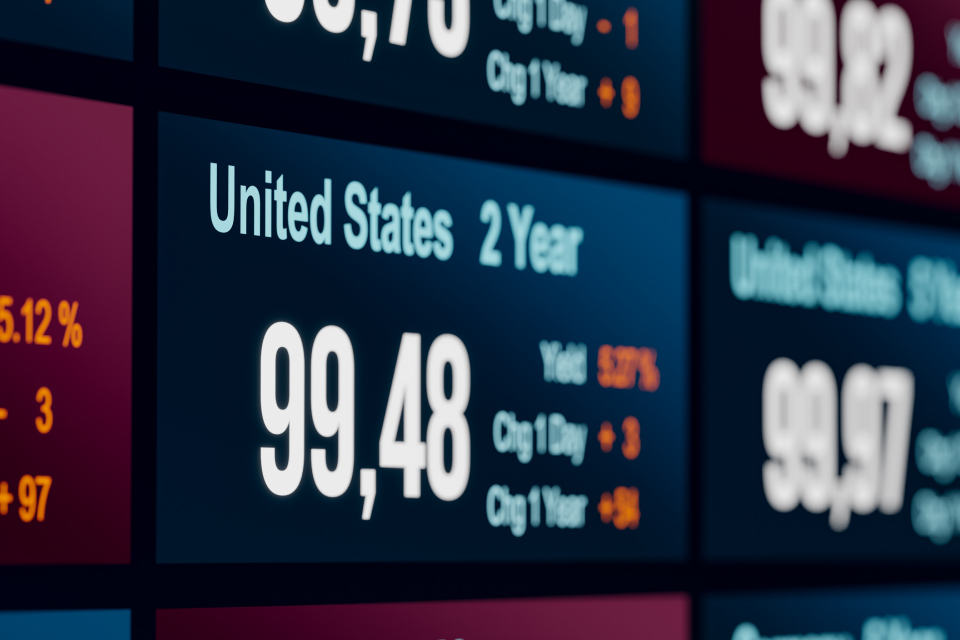
Digital display showing United States 2-year Treasury yield data, illustrating the concept of a Treasury Bond.
Economic Indicator 6 min read

What is a Treasury Bond?

06 Dec, 2024
Treasury Notes: Navigating Mid-Term US Debt Investments, illustrated by a financial graphic highlighting US treasury notes and investment strategies for mid-term debt.
Economic Indicator 7 min read

Treasury Notes: Navigating Mid-Term US Debt Investments

05 Dec, 2024
Platinum Trading: Opportunities in Precious Metals – A 3D-rendered image showcasing platinum bars, coins, and financial documents, symbolizing investment and market opportunities.
Commodities 5 min read

Platinum Trading: Opportunities in Precious Metals

04 Dec, 2024
a smartphone showing the MSCI logo with a blurred background of a computer screen
Economic Indicator 5 min read

How to Trade The MSCI World Index

21 Nov, 2024
yellow candlesticks in a blue background
Trading Strategies 6 min read

Advance-Decline Line: How to Use The Market Breadth Indicator

20 Nov, 2024
A digital financial chart displaying candlestick patterns and trend lines, representing the Simple Moving Average (SMA) for market analysis.
Trading Strategies 8 min read

Simple Moving Average (SMA)

19 Nov, 2024
cryptocurrency trading interface displaying various cryptocurrencies
Cryptocurrencies 5 min read

Crypto Staking - What it is And How it Works

11 Nov, 2024
Pen pointing at a digital trading chart displaying red and blue candlesticks and multiple technical indicators on a dark background, illustrating the concept of Position Trading.
Trading Strategies 10 min read

What is Position Trading?

09 Oct, 2024
Silhouette of an oil pumpjack on a hill of crude with a bold black downward arrow indicating falling oil prices, set against a modern city skyline.
Commodities 8 min read

Global Markets Stumble as Oil Prices Surge on Mideast Tensions

25 Sep, 2024
Bullish and Bearish Harami Candlestick Pattern: A financial chart with red and green candlesticks, featuring origami-style bull and bear figures representing market trends.
Trading Strategies 8 min read

Bullish and Bearish Harami Candlestick Pattern

24 Sep, 2024
McClellan Summation Index: A Deep Dive – A trader analyzing market trends on a tablet, with financial charts displayed in the background.
Trading Strategies 8 min read

McClellan Summation Index: A Deep Dive

24 Sep, 2024
Hand pointing at a digital financial chart with candlestick patterns and trend lines, representing trend-following strategies in trading.
Trading Strategies 5 min read

Top Trend Following Strategies

24 Sep, 2024
A conceptual representation of crypto yield farming, featuring a gold Bitcoin coin emerging from soil with miniature figurines of workers digging around it. Symbolizes cryptocurrency mining and investment growth.
Cryptocurrencies 5 min read

Yield Farming in Crypto: What Is It and How Does It Work?

24 Sep, 2024
Trading Strategies 5 min read

Beginner's Guide to Quantitative Trading

24 Sep, 2024
various popular cryptocurrency coins, including Bitcoin, Ethereum, Litecoin, Cardano, and others, placed on a laptop keyboard
Cryptocurrencies 5 min read

Crypto Day Trading: Top Strategies

24 Sep, 2024
A colorful digital stock chart featuring multiple trend lines and candlesticks, indicating market movement and sentiment analysis.
Trading Strategies 7 min read

How Does The Arms Index (TRIN) Analyzes Market Sentiment

24 Sep, 2024
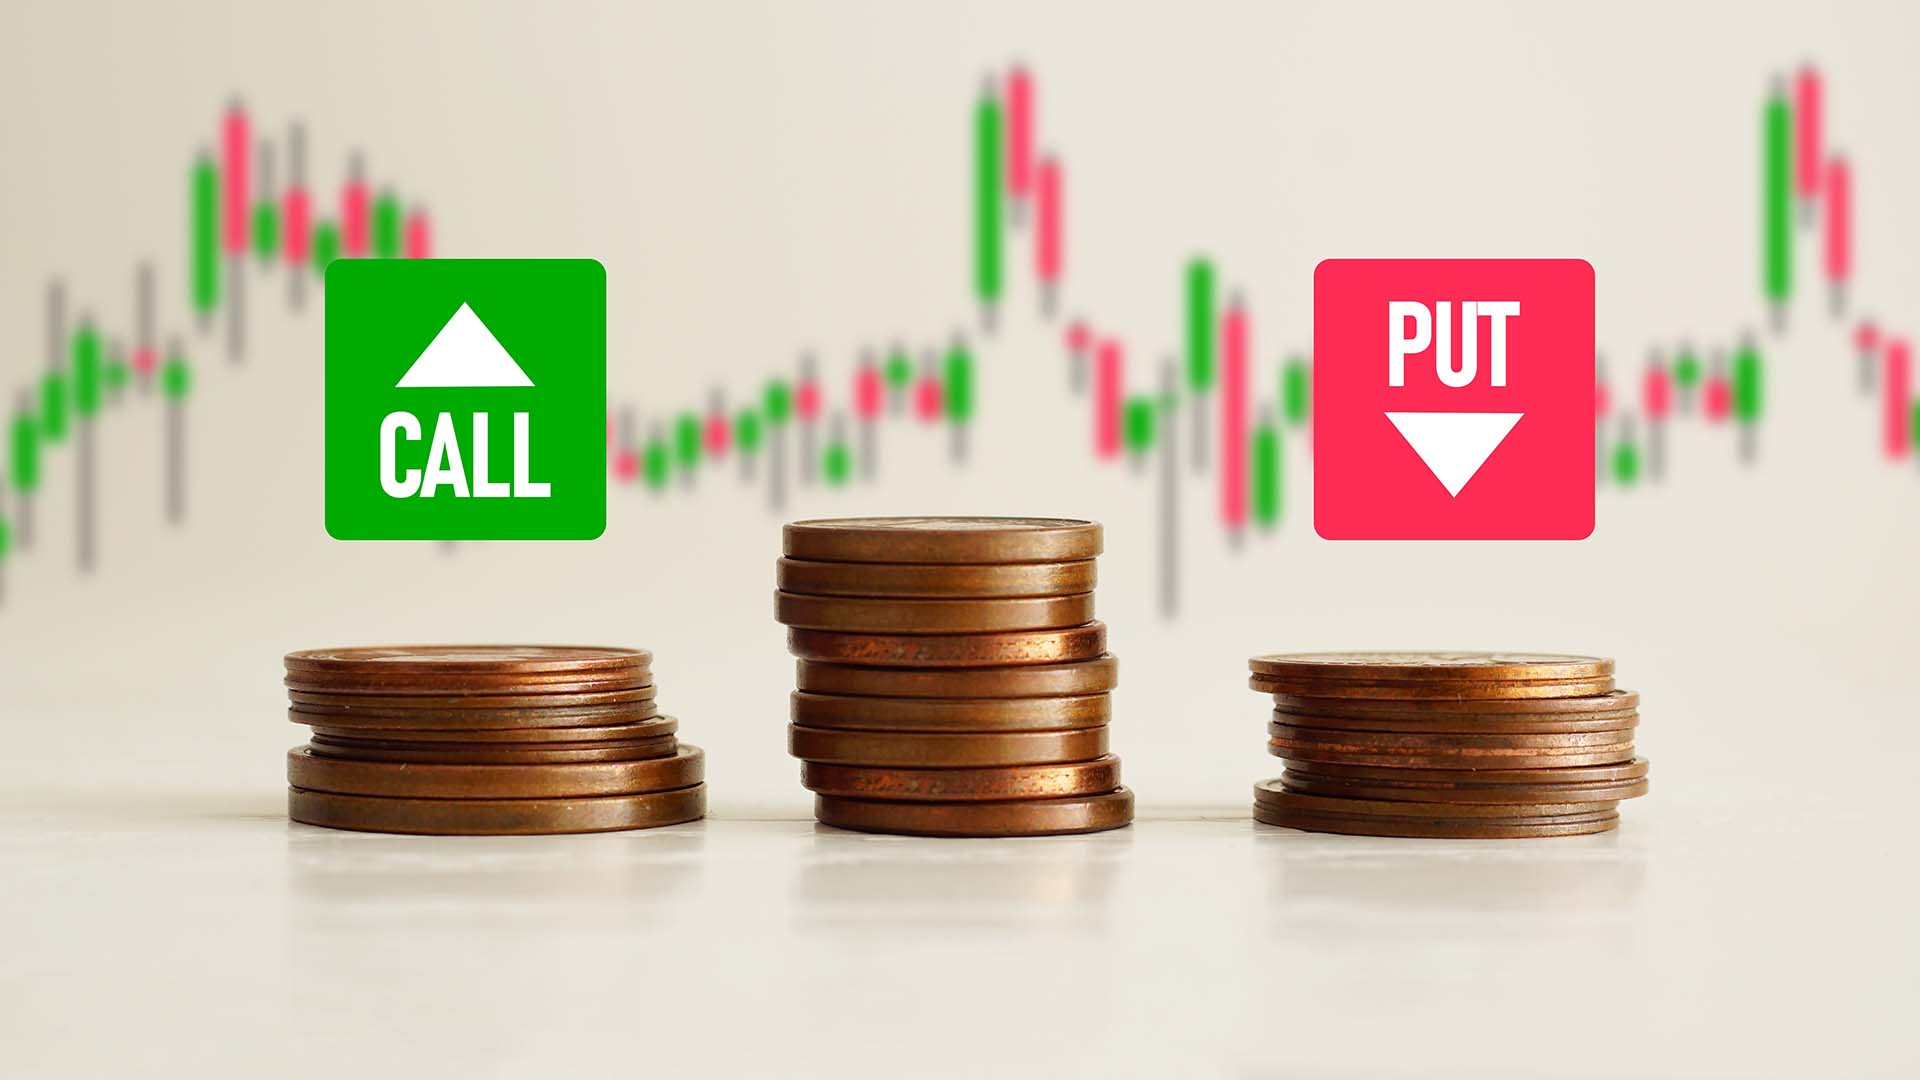
an image visually representing the Put/Call ratio
Trading Strategies 8 min read

How to Use Put/Call Ratio to Gauge Market Sentiment

24 Sep, 2024
Rate of Change (ROC) Indicator Explained, illustrated by an abstract financial chart with colorful candlesticks, vertical bar graphs, and white trend lines overlaid on a digital grid background.
Economic Indicator 8 min read

Rate of Change (ROC) Indicator Explained

24 Sep, 2024
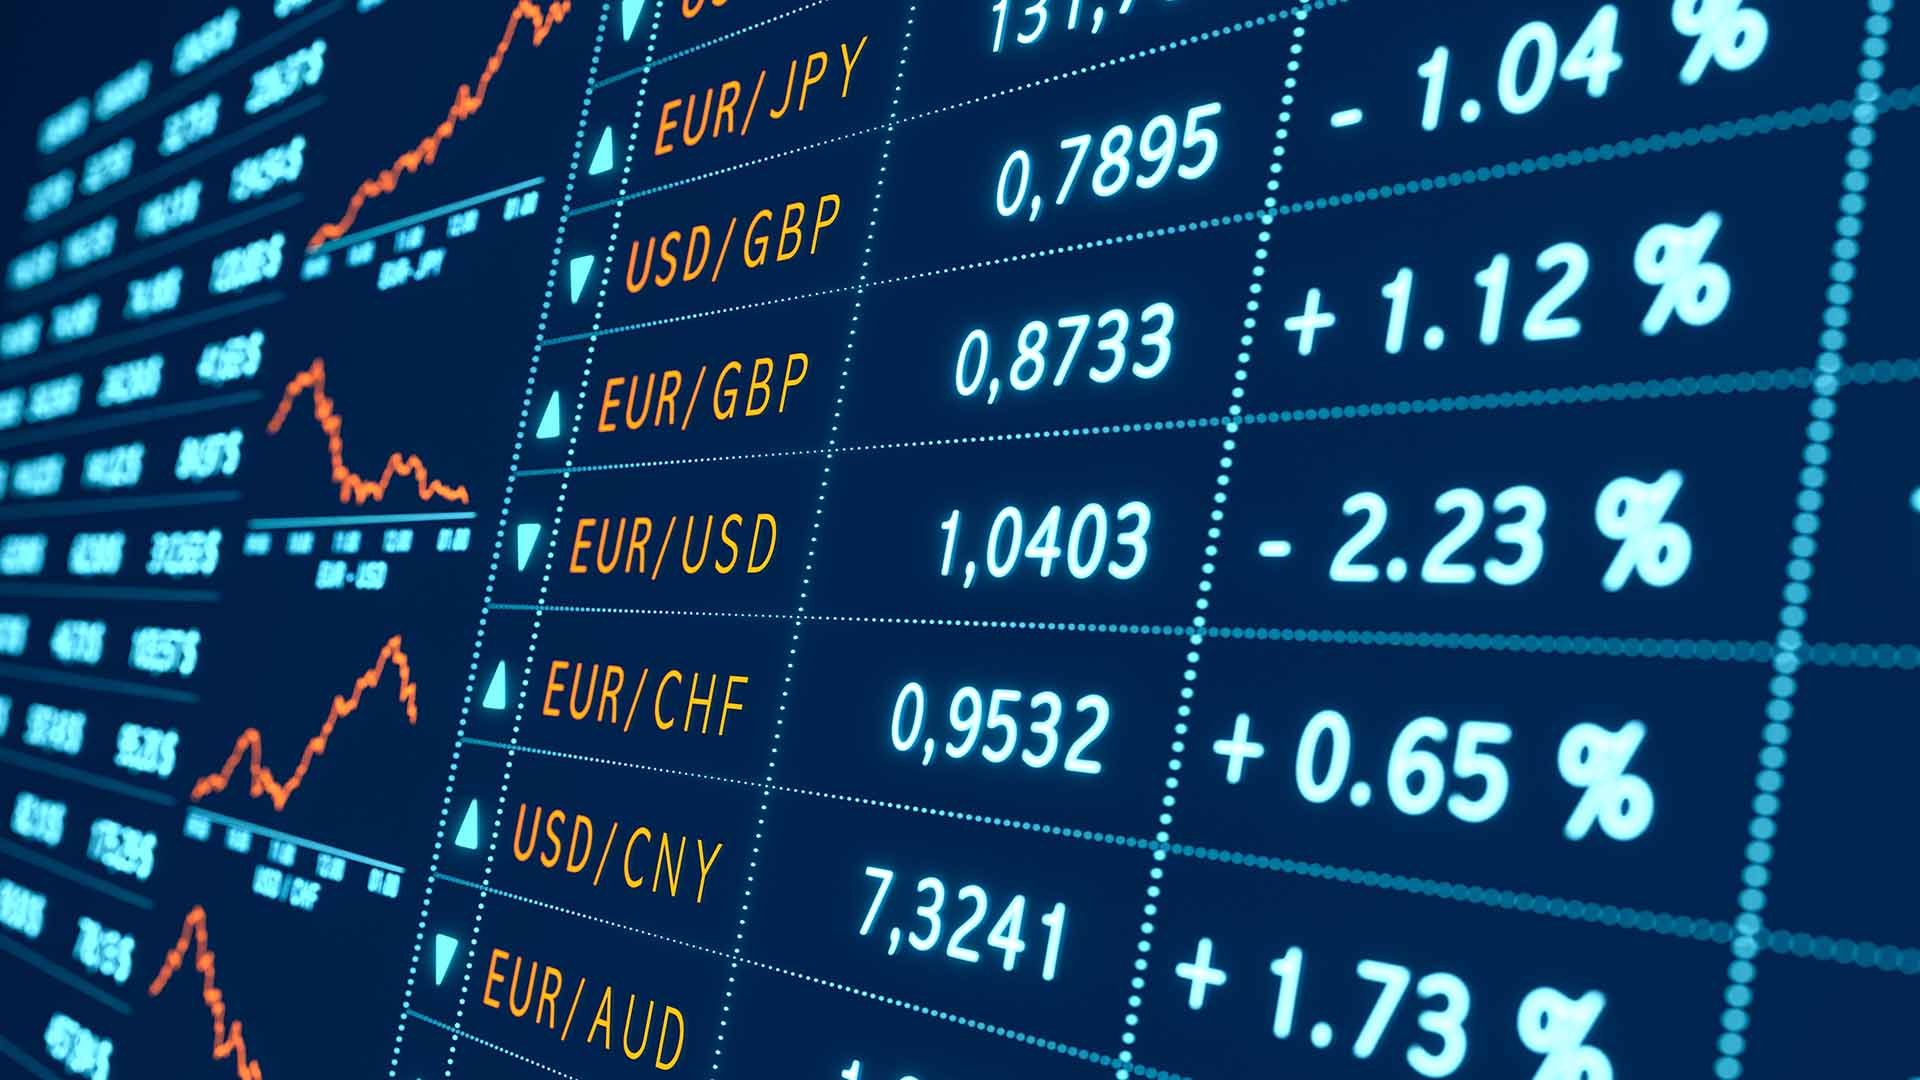
Strategies for Trading Volatile Forex Pairs, illustrated by a dynamic forex chart with sharp price movements and high volatility indicators.
Forex 8 min read

Strategies for Trading Volatile Forex Pairs

24 Sep, 2024
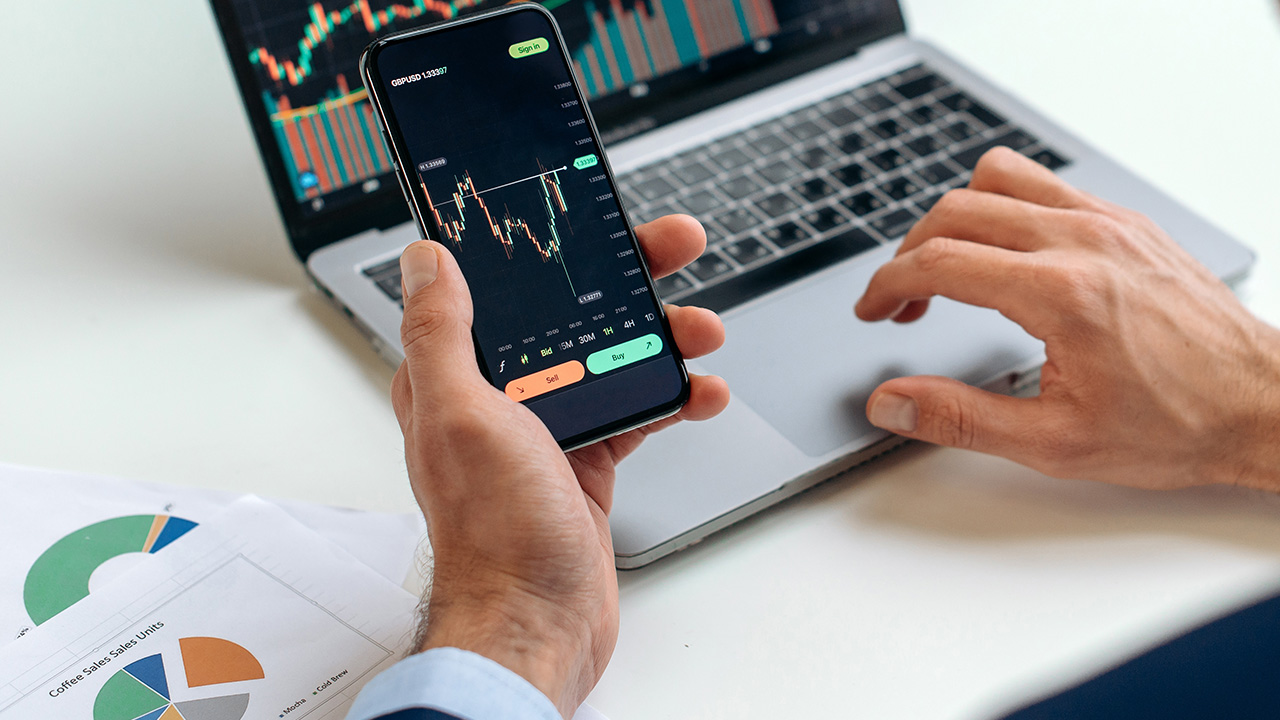
Trader using a smartphone and laptop to analyze financial charts, illustrating why use custom moving averages to tailor your strategy.
Trading Strategies 6 min read

Why Use Custom Moving Averages To Tailor Your Strategy

24 Sep, 2024

Buy and Hold: The Long-Term Trading Strategy – A wooden 'BUY' sign placed on a financial chart with a small clock, glasses, and a coffee cup, symbolizing long-term investment and market analysis.
Trading Strategies 8 min read

Buy and Hold: The Long-Term Trading Strategy

23 Sep, 2024
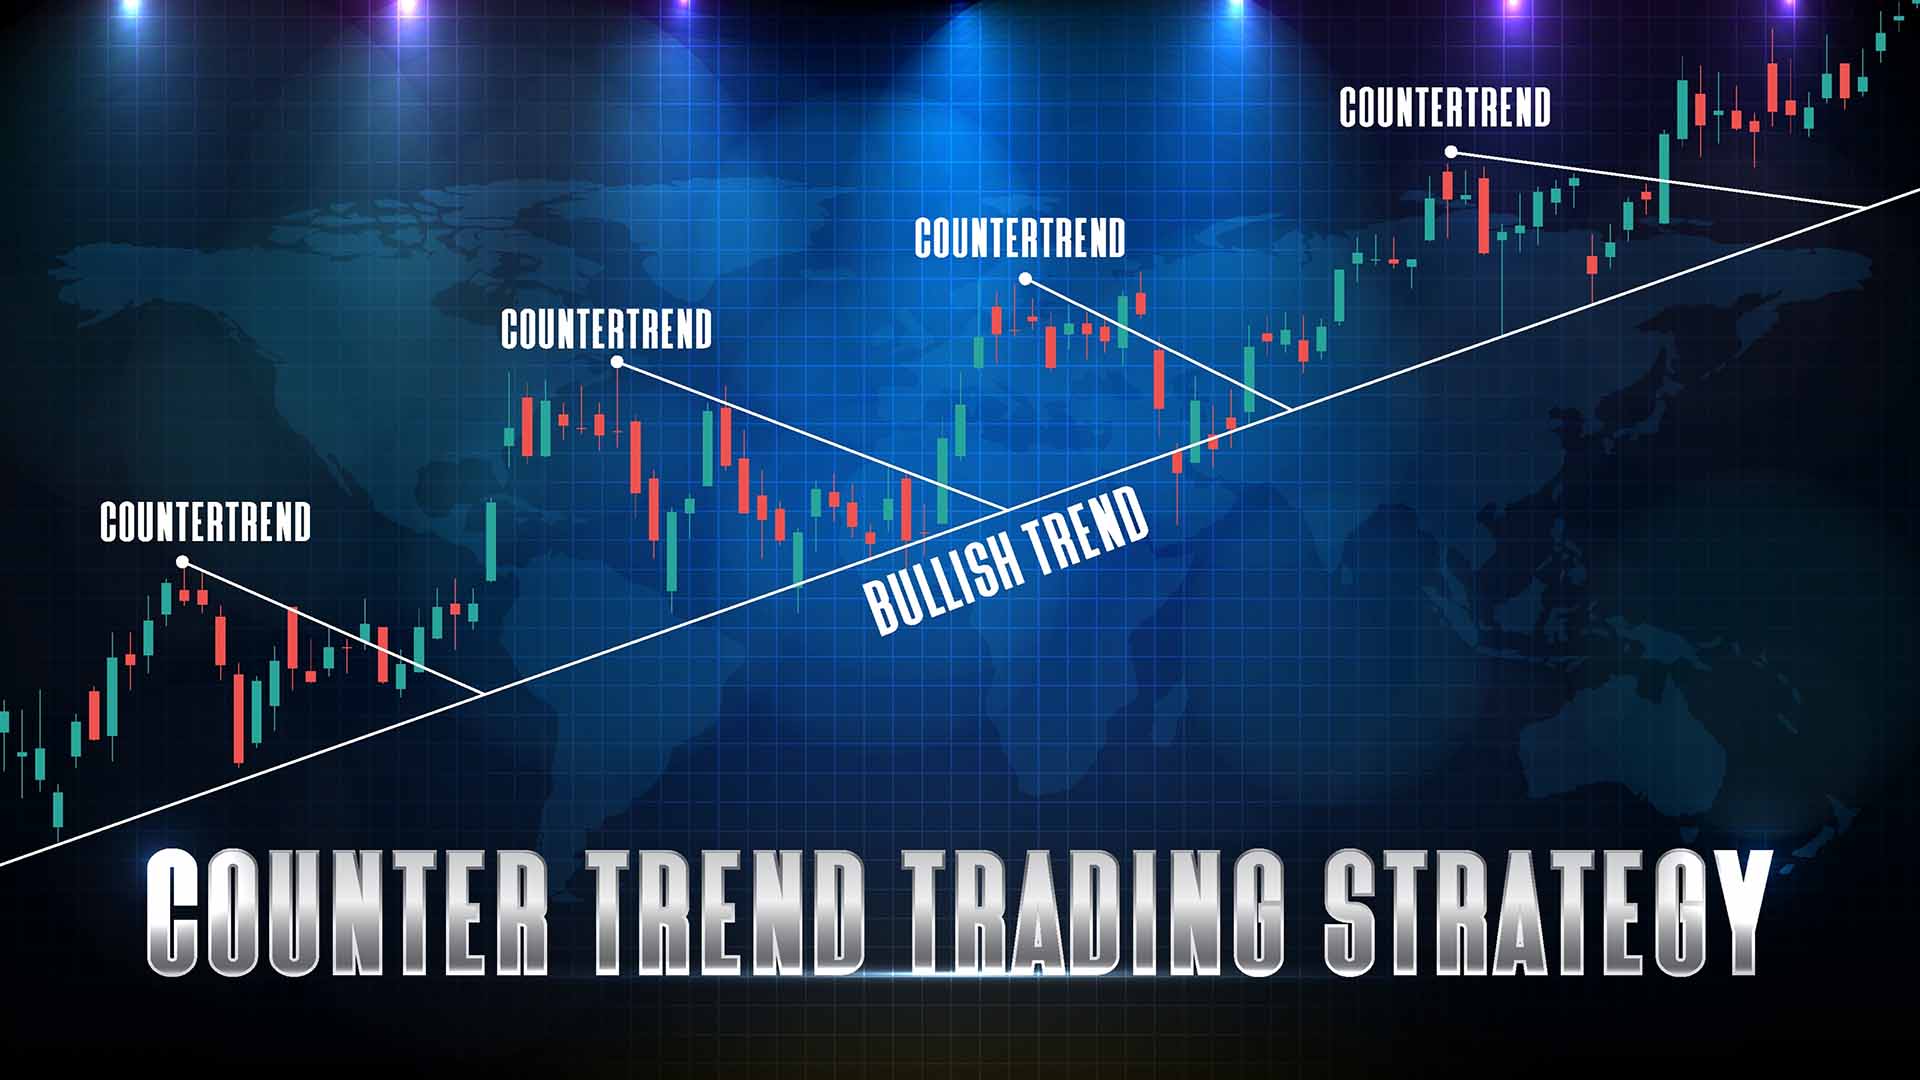
Counter-Trend Trading: Strategies and Tips – A forex candlestick chart with a bullish trend line and multiple countertrend movements labeled, illustrating trading opportunities in a counter-trend strategy.
Trading Strategies 8 min read

Counter-Trend Trading: Strategies and Tips

23 Sep, 2024
Cryptocurrencies 5 min read

How to Use HODLing: The Long-Term Crypto Strategy

23 Sep, 2024
Protective Put Strategy: The Complete Guide – A digital stock market chart featuring candlestick patterns and network connections, representing risk management in trading.
Trading Strategies 5 min read

Protective Put Strategy: The Complete Guide

23 Sep, 2024
A digital stock market chart with blue candlestick patterns and line graphs representing price movements, illustrating the concept of high-frequency trading (HFT) and its rapid execution strategies.
Trading Strategies 5 min read

What is High-Frequency Trading (HFT) And How Does it Work?

23 Sep, 2024
A worn American flag with deep folds and faded colors, illustrating dollar retreats ahead of US jobs report looms
Economic Indicator 5 min read

Dollar Retreats Ahead of US Jobs Report Looms

23 Sep, 2024
Straddle Options Strategy: Meaning, Examples and Benefits, illustrated by a person using a laptop displaying a chalkboard-style diagram of an 'Options Long Straddle' strategy.
Trading Strategies 8 min read

Straddle Options Strategy: Meaning, Examples and Benefits

23 Sep, 2024
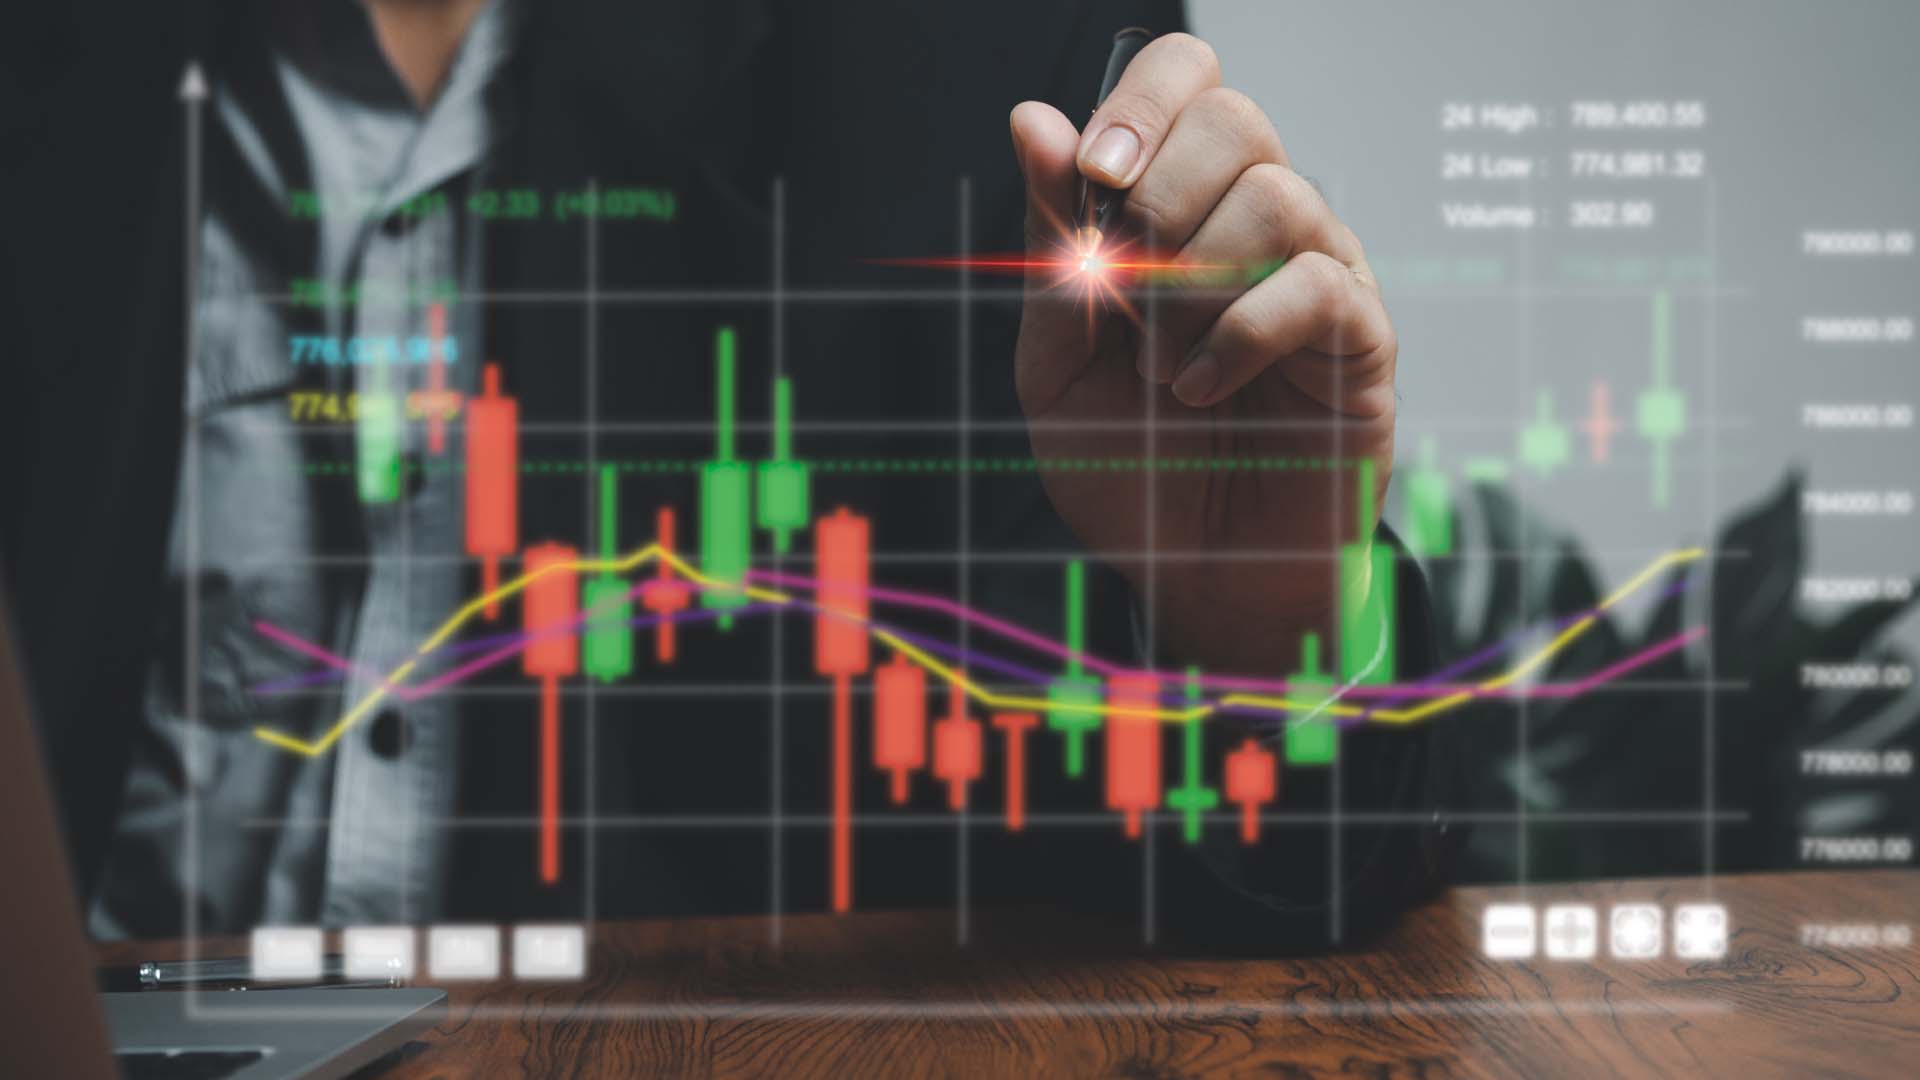
Technical Indicator Composites: The Complete Guide, illustrated by a trading chart featuring candlestick patterns, moving averages, and trading statistics like "24 High", "24 Low", and "Volume".
Trading Strategies 5 min read

Technical Indicator Composites: The Complete Guide

23 Sep, 2024
Colorful digital financial chart showing green and red candlesticks against a grid background, representing market volatility and trading activity, illustrating the concept of a Covered Call Options Strategy.
Trading Strategies 6 min read

What is a Covered Call Options Strategy?

23 Sep, 2024
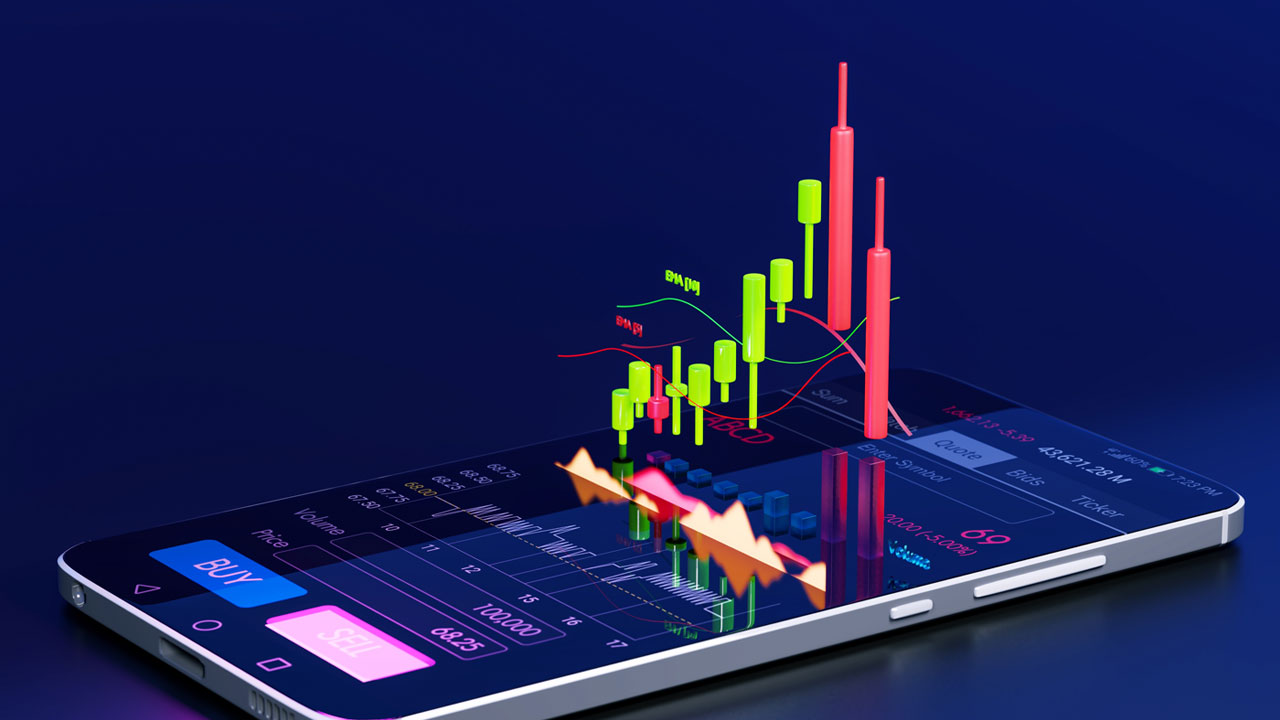
Take-Profit Order concept illustrated with a 3D candlestick chart emerging from a smartphone screen, displaying buy and sell options.
Forex 8 min read

What is a Take-Profit Order?

20 Sep, 2024
A trader holding a Bitcoin coin, symbolizing the process of developing a personal crypto trading strategy.
Forex 8 min read

How to Build Your Own Crypto Trading Strategy

19 Sep, 2024
A professional trader taking notes with a tablet and printed trading journal on a desk, representing the process of creating a crypto trading journal.
Cryptocurrencies 5 min read

How to Create a Crypto Trading Journal

19 Sep, 2024

How to Use Fundamental Analysis for Crypto Trading
Cryptocurrencies 3 min read

How to Use Fundamental Analysis for Crypto Trading

19 Sep, 2024
How to Use Rounding Top Pattern to Identify Bearish Signals
Trading Strategies 5 min read

How to Use Rounding Top Pattern to Identify Bearish Signals

19 Sep, 2024
Seasonal Trading: The Complete Guide, illustrated by a digital stock ticker board displaying market prices, symbols, and directional arrows in green and blue.
Trading Strategies 8 min read

Seasonal Trading: The Complete Guide

19 Sep, 2024
Butterfly Pattern Trading: A Comprehensive Guide – A close-up of a digital financial chart displaying red and green candlestick patterns with glowing highlights, illustrating market analysis and trading strategies.
Trading Strategies 8 min read

Butterfly Pattern Trading: A Comprehensive Guide

18 Sep, 2024
Diamond Trading Pattern: Comprehensive Guide for Traders – A digital financial chart displaying market trends and candlestick patterns, illustrating key formations traders use to identify diamond chart patterns.
Trading Strategies 8 min read

Diamond Trading Pattern: Comprehensive Guide for Traders

18 Sep, 2024
Guide to Rounding Bottom Pattern – A hand pointing at a digital candlestick chart with an upward trend, illustrating a rounding bottom pattern in trading analysis.
Trading Strategies 5 min read

Guide to Rounding Bottom Pattern

18 Sep, 2024
How to Use Dark Cloud Cover to Identify Trading Signals
Trading Strategies 5 min read

How to Use Dark Cloud Cover to Identify Trading Signals

18 Sep, 2024
How to Use Technical Analysis for Commodities Trading
Commodities

How to Use Technical Analysis for Commodities Trading

18 Sep, 2024
M Trading Pattern – Double Top Strategy illustrated with candlestick charts on a trading screen, highlighting key market movements and trend reversals.
Trading Strategies

M Trading Pattern: Master Double Top Strategy

18 Sep, 2024
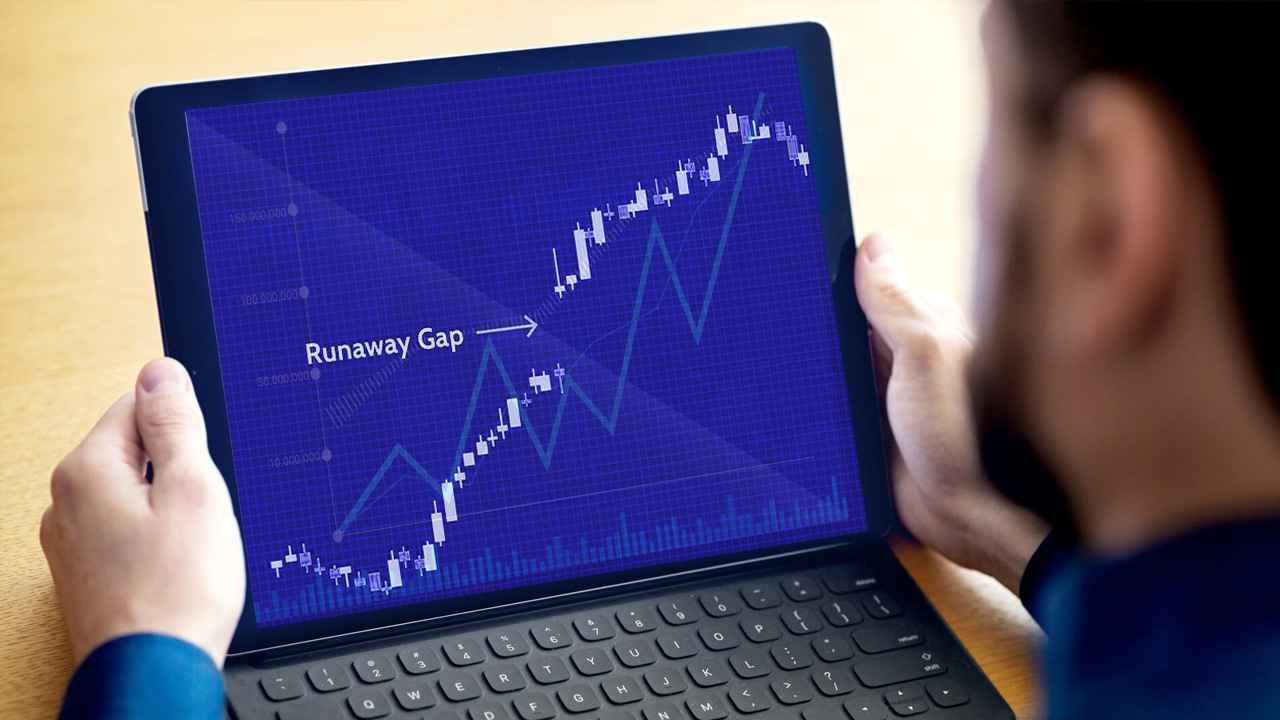
Runaway Gap: Identifying and Trading Trends – A trader analyzing a digital stock chart on a tablet, highlighting a runaway gap in an upward trend.
Trading Strategies 5 min read

Runaway Gap: Identifying and Trading Trends

18 Sep, 2024
Trader analyzing multiple charts on monitors, featuring MACD, moving averages, and other key indicators for swing trading.
Trading Strategies 8 min read

Top Indicators for Swing Trading

18 Sep, 2024
 A golden bull and bear facing off against a background of a financial candlestick chart, symbolizing bullish and bearish market trends when trading the engulfing pattern.
Trading Strategies 5 min read

Trading the Engulfing Pattern: Bullish & Bearish

18 Sep, 2024
A trader analyzing a computer screen displaying a chart and candlestick patterns for the Piercing Line pattern, with trading strategies for bearish and bullish setups.
Trading Strategies 5 min read

Trading the Piercing Line Pattern: A Quick Guide

18 Sep, 2024
W Pattern Trading: Mastering the Double Bottom Strategy – A key approach in technical analysis for spotting trend reversals and optimizing trade entries.
Trading Strategies 8 min read

W Pattern Trading: Mastering the Double Bottom Strategy

18 Sep, 2024
A collage of US dollar notes illustrating dollar fluctuation as investors weigh rate cut chances
Forex 7 min read

Dollar to Fluctuate as Investors Weigh Rate Cut Chances

18 Sep, 2024
A laptop showing a hand of a robot, illustrating how AI is changing the forex market in 2024
Forex 5 min read

Forex and AI: How is AI Changing the Forex Market in 2024?

18 Sep, 2024

A gold bar labeled "999.9 FINE GOLD" lies on a financial newspaper displaying a rising price chart.
Commodities 5 min read

Gold Prices Falling After a Period of Strong Growth

18 Sep, 2024
Questions to Ask When Trading Trends, illustrated by two businessmen in suits discussing in an office, with one pointing at a laptop screen with a pen.
Trading Strategies 5 min read

Questions to Ask When Trading Trends

18 Sep, 2024
Top Ways to Minimize Missed Trades, illustrated by an image of a person holding his head in shock inside a trading office with screens and charts.
Trading Strategies 8 min read

Top Ways to Minimize Missed Trades

18 Sep, 2024
"USD to Range-Bound Amidst Central Bank Speculation, illustrated by a close-up of US dollar bills, a financial chart with red and blue lines, and a calculator symbolizing market analysis and trading sentiment."
Commodities 7 min read

USD to Range-Bound Amidst Central Bank Speculation

18 Sep, 2024
Hand pointing at a digital stock market chart displaying candlesticks and moving averages, symbolizing market breadth indicators.
Trading Strategies 10 min read

Top Market Breadth Indicators

16 Sep, 2024
A person analyzing a trading chart on a laptop screen, displaying a wedge pattern with candlestick formations and trend lines.
Trading Strategies 8 min read

Trading Wedge Pattern: A Comprehensive Guide

16 Sep, 2024
Forex Trading Week Ahead: 16th September
Week Ahead 5 min read

Forex Trading Week Ahead: 16th September

16 Sep, 2024
a person holding a tablet displaying a forex trading chart with technical indicators.
Trading Strategies 5 min read

Custom Oscillators To Personalizing Your Trading

10 Sep, 2024
A picture showing an hourglass on top of a laptop, illustrating forex cycles analysis and timing market movements
Trading Strategies 8 min read

Forex Cycles Analysis: Timing Market Movements

10 Sep, 2024
A digital globe with yen and dollar symbols, illustrating Forex Trading Week Ahead: 9th September.
Week Ahead 5 min read

Forex Trading Week Ahead: 9th September

09 Sep, 2024
Exploring Exotic Forex Pairs: Opportunities and Risks – A trader in a suit using binoculars, analyzing financial data on multiple digital screens displaying market charts and currency exchange rates.
Forex 5 min read

Exploring Exotic Forex Pairs: Opportunities and Risks

07 Sep, 2024
A digital trading interface displaying various cryptocurrency prices, including Bitcoin, Ethereum, BTC Cash, and EOS, with buy and sell options and real-time market data.
Economic Indicator 5 min read

Trading the Russell 2000: Everything You Should Know

05 Sep, 2024
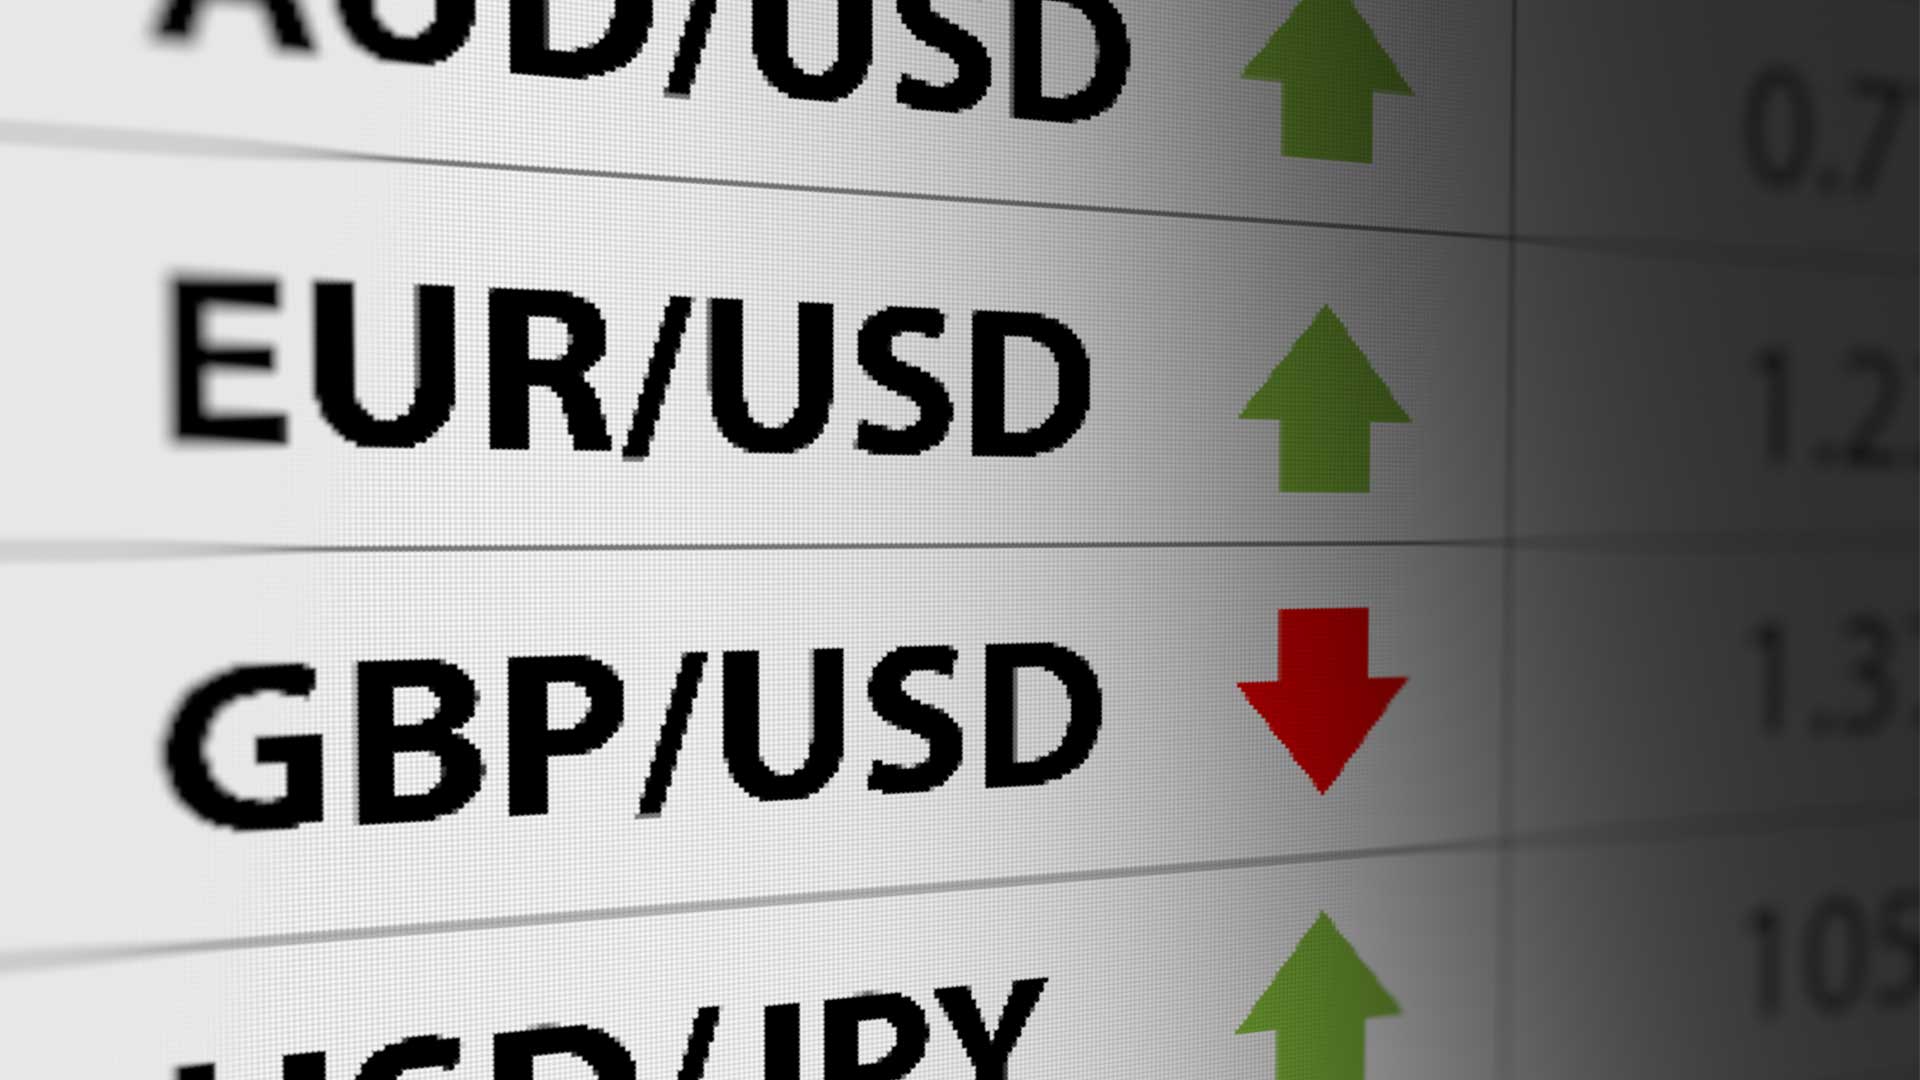
Pairs Trading: How to Use it For Hedging, illustrated by EUR/USD with a green up arrow and GBP/USD with a red down arrow.
Trading Strategies 5 min read

Pairs Trading: How to Use it For Hedging

05 Sep, 2024
Commitment of Traders: What are COT Reports & How to Read Them – A financial analyst pointing at a trading screen displaying COT data, market positions, and price trends with financial charts in the background.
Economic Indicator 5 min read

Commitment of Traders: What are COT Reports & How to Read them

04 Sep, 2024
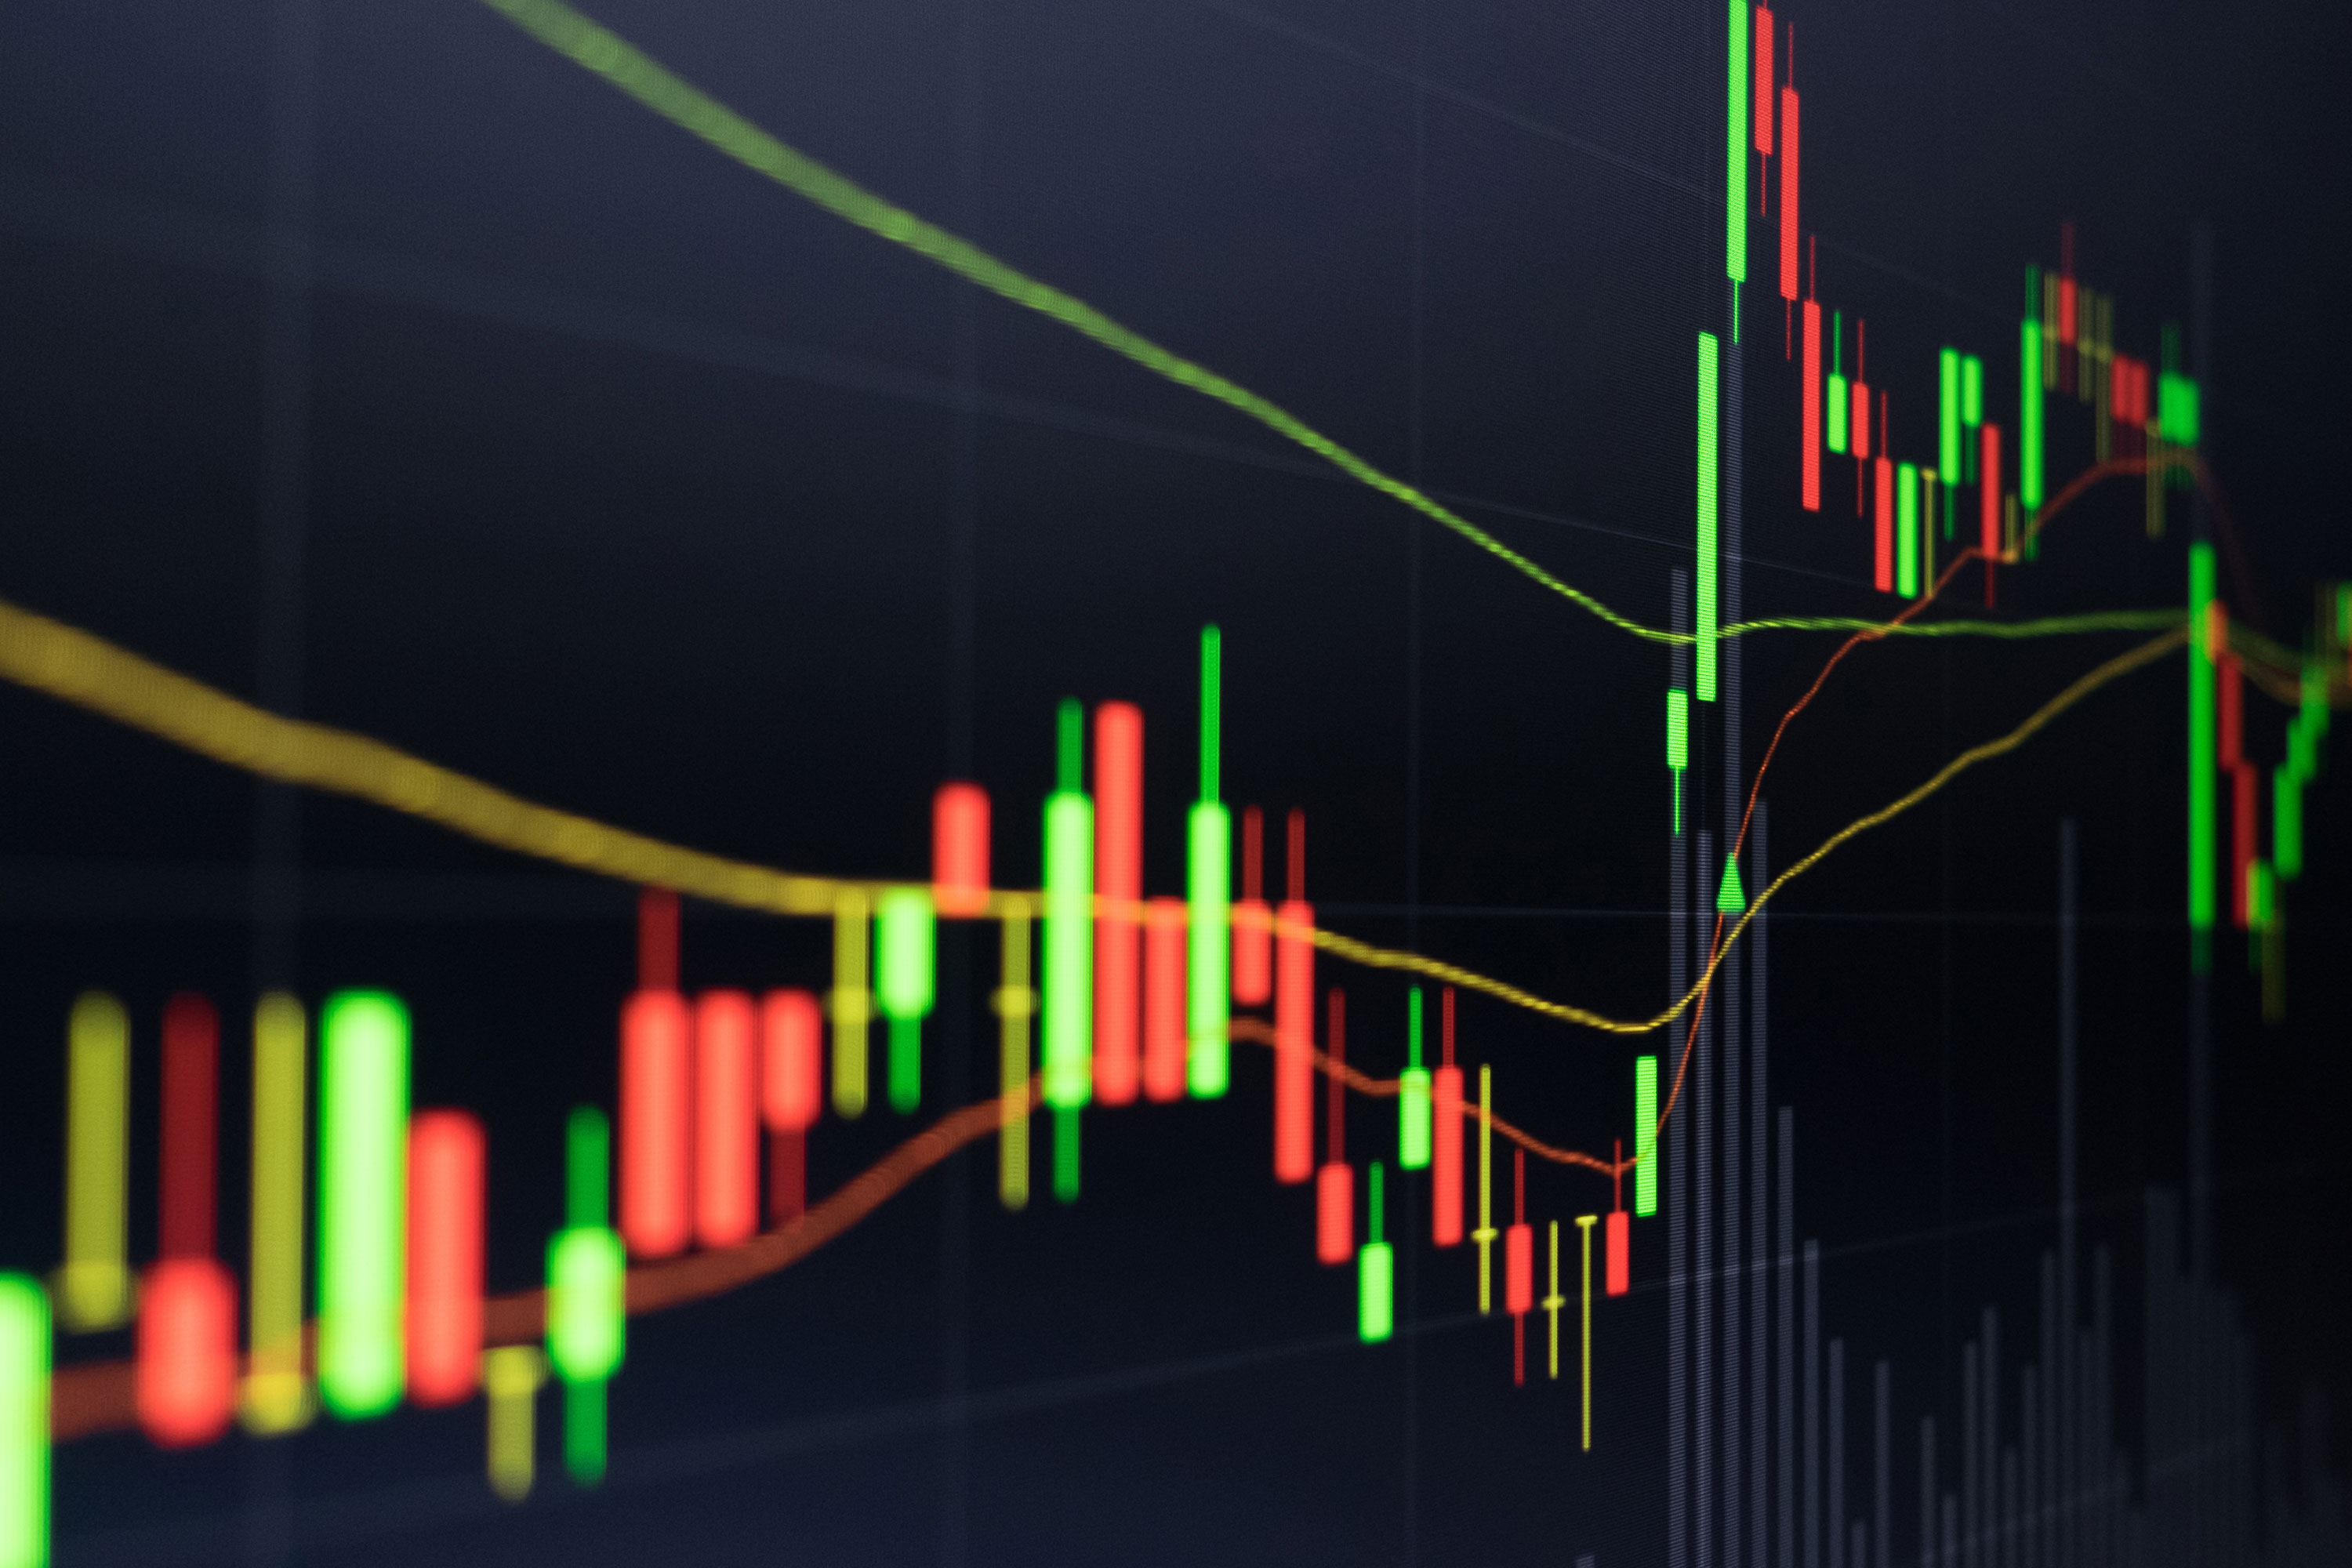
Exhaustion Gap: How to Trade the Final Push – A candlestick chart with red and green bars, moving averages, and volume indicators representing price fluctuations in financial markets.
Trading Strategies 8 min read

Exhaustion Gap: How to Trade the Final Push

04 Sep, 2024
Understanding Common Gap in Trading with a digital candlestick chart showing price movements and market fluctuations.
Trading Strategies 5 min read

Understanding Common Gap in Trading

04 Sep, 2024
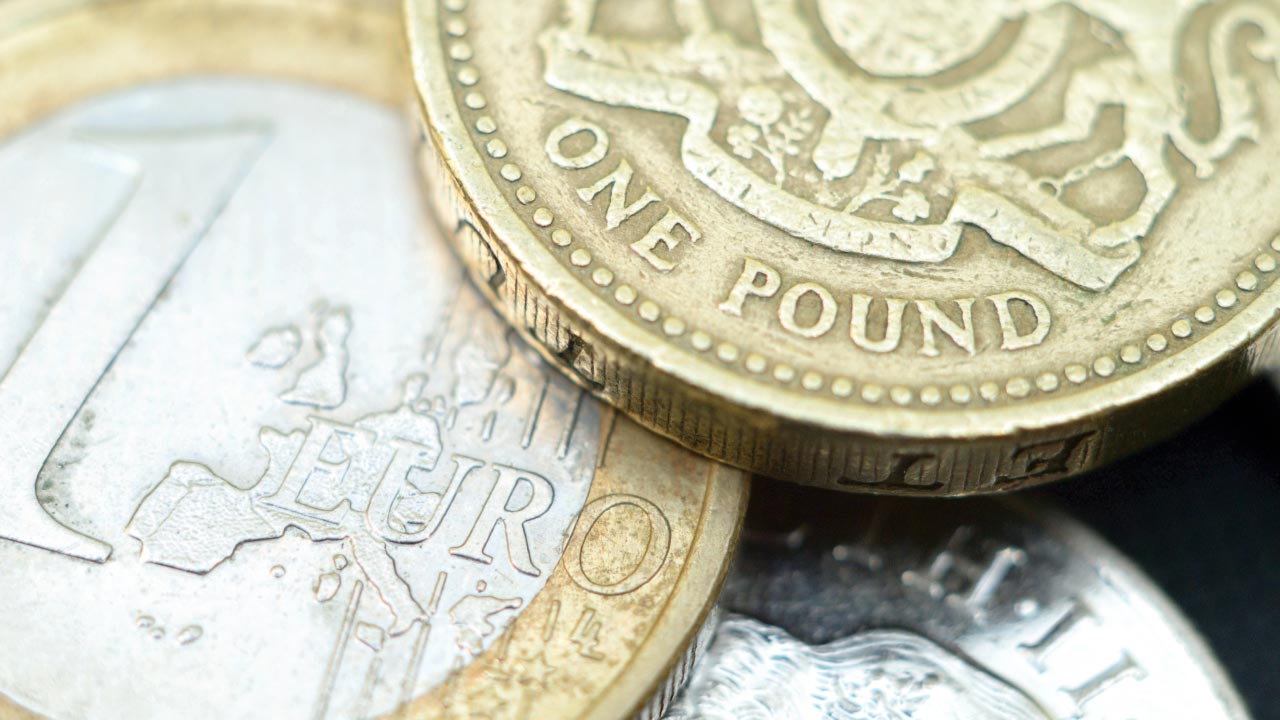
currency coins featuring a British one pound coin overlapping a one euro coin
Daily Forex Analysis 5 min read

British Pound Reversal

29 Aug, 2024
An image of a globe with yen and dollar symbols, illustrating Forex Trading Week Ahead: 26th August.
Week Ahead 5 min read

Forex Trading Week Ahead: 26th August

26 Aug, 2024
Man with glasses monitoring financial charts on a laptop and smartphone in a modern office setting, focusing on trading data.
Week Ahead 5 min read

Forex Week Ahead Analysis: 26th August

26 Aug, 2024
How to trade GBP/JPY
Daily Forex Analysis 3 min read

How to trade GBP/JPY

22 Aug, 2024
Stacked gold bars with "999.9 FINE GOLD" inscriptions
Daily Forex Analysis 5 min read

Gold Makes New Highs

21 Aug, 2024
Forex Weekly Trading Ideas: 19th August
Week Ahead 5 min read

Forex Weekly Trading Ideas: 19th August

19 Aug, 2024
Forex Weekly Trading Ideas: 19th August
Week Ahead 5 min read

Forex Weekly Trading Ideas: 19th August (1)

19 Aug, 2024
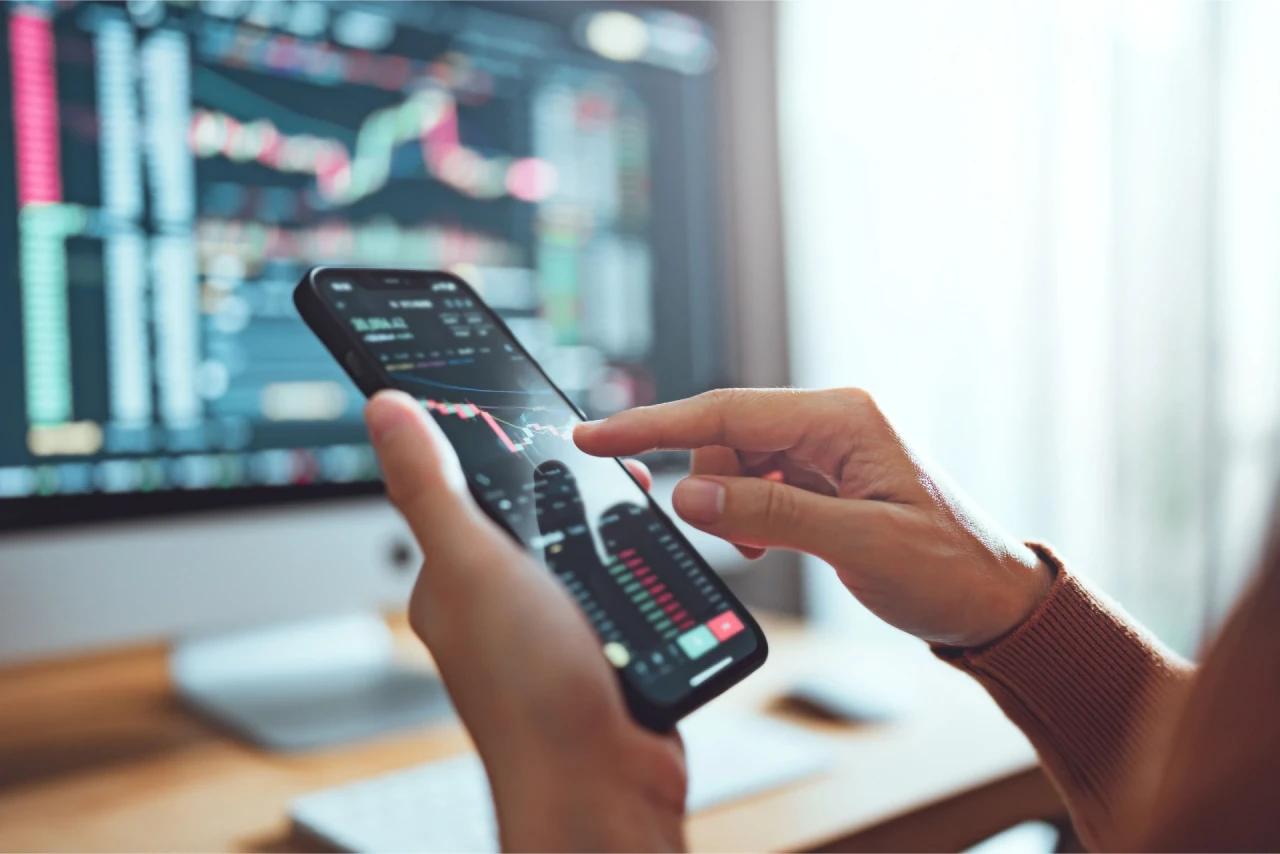
A person using a smartphone to analyze stock market charts, with a trading dashboard visible on a computer monitor in the background, illustrating why retail traders are often wrong.
Daily Forex Analysis 5 min read

Why are retail traders wrong?

19 Aug, 2024
The image features the word "UNEMPLOYMENT" spelled out with white cube beads bearing bold black letters.
Daily Forex Analysis 8 min read

GBP Rallies Despite Unemployment Claims Shock

14 Aug, 2024
Forex Weekly Trading Ideas: 12th August
Week Ahead 5 min read

Forex Weekly Trading Ideas: 12th August

12 Aug, 2024
Japanese Markets to Rebound After its Biggest Drop in August's First Week — Businessman in a suit checking his phone in front of an electronic stock market board displaying Japanese and international indices, highlighting the rebound of Japan's equities.
CFD 5 min read

Japanese Markets to Rebound After its Biggest Drop in August's First Week

09 Aug, 2024
Top Market Predictions for Q3 2024, illustrated by a graphic sign of 2024 on a blue background.
Shares 6 min read

Top Market Predictions for Q3 2024

07 Aug, 2024
multiple stacked gold bars, each marked with "999.9 FINE GOLD"
Commodities 3 min read

Gold Trends for Q3 2024: What to Expect?

07 Aug, 2024
Navigating the EURUSD Ahead of ECB's Interest Rate Decision, illustrated by Jon Kibbler in front of a forex trading chart with yellow annotations and the text 'BUY HERE?'.
Daily Forex Analysis 2 min read

Navigating the EURUSD Ahead of ECB's Interest Rate Decision

07 Aug, 2024
mobile phone showing real-time trading
Daily Forex Analysis 5 min read

Correction or Recession?

05 Aug, 2024
"Week Ahead featured image for August 5th, illustrating the concept of global forex markets with a digital globe and yen and dollar symbols."
Week Ahead 8 min read

Weekly Forex Trading Ideas- 5th August

05 Aug, 2024
An image of Jonathan Kibler with bold text overlay reading "What a week to be a forex trader," illustrating the excitement and market movement highlighted in the phrase.
Daily Forex Analysis 5 min read

What a week to be a forex trader

02 Aug, 2024
How to Use The Umbrella Pattern Trading – A digital trading screen displaying candlestick patterns, price movements, and technical indicators for EUR/USD, highlighting the umbrella pattern in forex trading.
Trading Strategies 10 min read

How to Use The Umbrella Pattern Trading

01 Aug, 2024
An image that features financial market analysis with a digital, futuristic aesthetic.
Trading Strategies 10 min read

Dragon Pattern Trading: A Comprehensive Guide

29 Jul, 2024
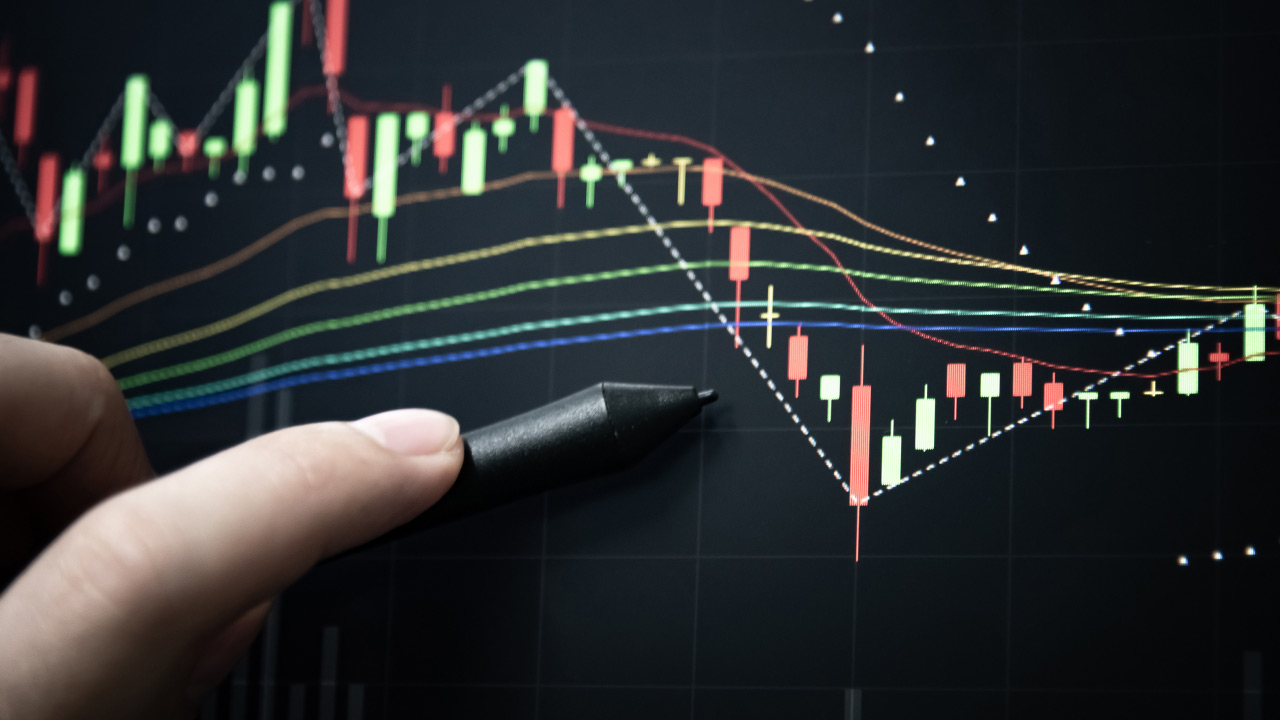
How to Use The Megaphone Trading Pattern – A trader analyzing a financial chart with a megaphone pattern, featuring candlestick formations, trend lines, and moving averages on a digital trading screen.
Trading Strategies 8 min read

How to Use The Megaphone Trading Pattern

29 Jul, 2024
Week Ahead featured image for July 29
Week Ahead 8 min read

Forex Weekly Trading Ideas: 29th July

29 Jul, 2024
Managing Emotions in High-Stakes Trading — illustrated by a stressed businessman in a suit sitting at his desk, holding his glasses and resting his head on his hand, with a trading chart showing losses displayed on his computer screen in the background.
Trading Strategies 8 min read

Managing Emotions in High-Stakes Trading

29 Jul, 2024
a woman sitting at a desk with her hands clasped and head bowed in frustration
Trading Strategies 4 min read

How to Overcome the Fear of Losing Your Gains

29 Jul, 2024
"Weekly Forex Trading Ideas: 29th July, illustrating the concept of global forex markets with a digital globe and yen and dollar symbols."
Daily Forex Analysis 5 min read

Weekly Forex Trading Ideas: 29th July

29 Jul, 2024
Harmonic Trading Patterns – A digital candlestick chart illustrating price movements with geometric patterns, commonly used in harmonic trading strategies for market analysis.
Trading Strategies 8 min read

Harmonic Trading Patterns

25 Jul, 2024
featured image for Daily Forex for July 24th
Daily Forex Analysis 8 min read

How To Trade USD/CAD: 24th July

25 Jul, 2024
Triangle Pattern Trading: Master Technical Analysis with a digital stock market chart displayed on a smartphone, featuring candlestick patterns and trendlines.
Trading Strategies 7 min read

Triangle Pattern Trading: Master Technical Analysis

24 Jul, 2024
A digital cryptocurrency trading interface displaying price charts, buy and sell options, and various crypto assets like Bitcoin, Ethereum, and EOS, helping traders analyze crypto charts.
8 min read

How to Read Crypto Charts?

24 Jul, 2024
a person’s hand writing in a spiral notebook with a gold pen, seated at a desk with multiple monitors displaying financial trading charts and stock market data
Trading Strategies 4 min read

How to Create a Trading Strategy

24 Jul, 2024
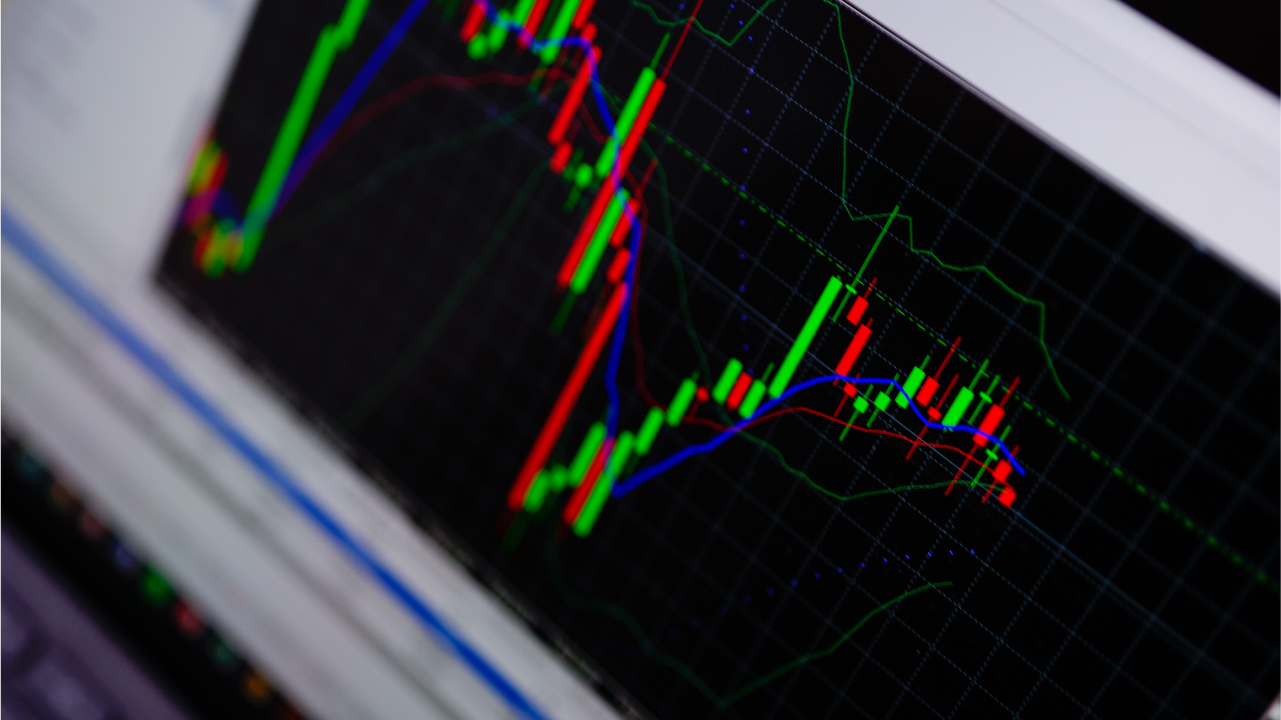
a trading chart displayed on a screen, featuring candlesticks in green and red
MetaTrader 7 min read

Can You Set Up Expert Advisors In Metatrader 4?

23 Jul, 2024
Forex Weekly Trading Ideas: 22nd July
Week Ahead 5 min read

Forex Weekly Trading Ideas: 22nd July

21 Jul, 2024
COT report black background with Jon
Daily Forex Analysis 6 min read

How To Trade CoT Reports

17 Jul, 2024
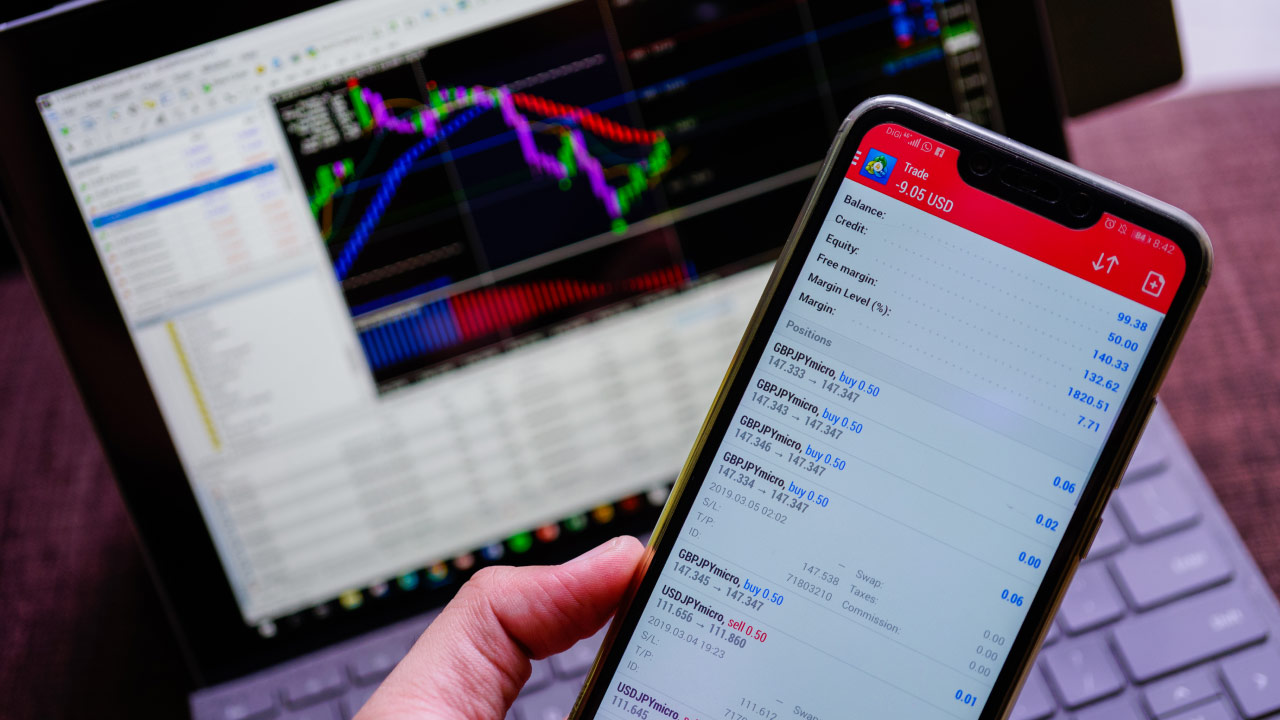
A trader holding a smartphone displaying an MT5 trading account with active positions, while a laptop screen in the background shows the MetaTrader 5 platform with trading charts and indicators. Learn How to Place a Trade on MT5 efficiently.
MetaTrader 12 min read

How to Place a Trade on MT5

17 Jul, 2024
stairs with percentage
Week Ahead 5 min read

Forex Weekly Trading Ideas: 15th July

14 Jul, 2024

A 3D-rendered forex trading chart with bar graphs and a magnifying glass, illustrating strategies on how to achieve consistent wins in forex trading.
Daily Forex Analysis 10 min read

How to Achieve Consistent Wins in Forex Trading

12 Jul, 2024
A 3D-rendered black forex trading concept with stacked coins and dynamic arrows, illustrating why trading with data matters for informed financial decisions.
Daily Forex Analysis 8 min read

Why Trading With Data Matters

10 Jul, 2024
Blueberry Week Ahead Analysis for July 8th, 2024, featuring expert insights and key forex trading ideas to navigate the upcoming market trends.
Week Ahead 8 min read

Weekly Forex Trading Ideas: 8th July

07 Jul, 2024
A golden Bitcoin coin placed on a digital trading chart displaying candlestick patterns and technical analysis, representing the use of top trading indicators in crypto trading.
Cryptocurrencies 8 min read

Top Indicators for Crypto Trading

05 Jul, 2024
 A promotional image featuring market analyst Jon Kibbler on the right
Daily Forex Analysis 8 min read

Gold Finds Support Amid Rising Risk Events

04 Jul, 2024
Effective Risk Management in Crypto Trading – A trader in a professional setting analyzing market data on a tablet, with multiple monitors displaying financial charts and trading indicators in the background.
Cryptocurrencies 8 min read

Effective Risk Management in Crypto Trading

02 Jul, 2024
Cryptocurrency Trading Psychology: Everything Traders Should Know – A focused trader analyzing market charts on multiple monitors while holding a cup of coffee, highlighting the importance of discipline and mindset in crypto trading.
Cryptocurrencies 8 min read

Cryptocurrency Trading Psychology: Everything Traders Should Know

02 Jul, 2024
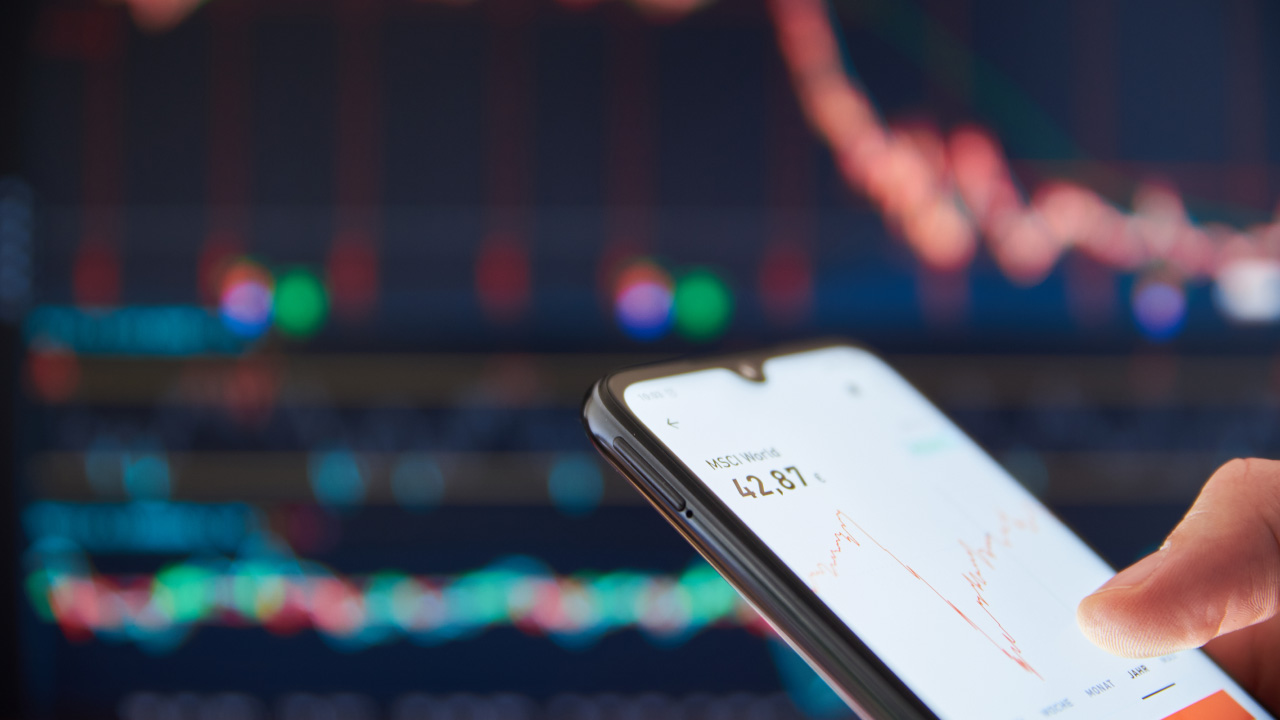
A trader monitors price movements on a smartphone with a blurred trading chart in the background, illustrating how to set up the perfect trading routine.
Trading Strategies 8 min read

How to Setup the Perfect Trading Routine?

28 Jun, 2024
astressed trader sits at his desk with his hands on his forehead, surrounded by multiple screens displaying market charts, representing the challenges of handling trading slumps.
Trading Strategies 8 min read

How to Handle Trading Slumps

28 Jun, 2024
MetaTrader 5 logo with a hand stopping a row of falling wooden blocks, symbolizing risk management and trailing stop-loss in trading.
MetaTrader 8 min read

How to Set a Trailing Stop-Loss on MT5?

28 Jun, 2024
An image symbolizing cryptocurrency trading time frames, featuring a clock, Bitcoin and Ethereum coins, and dice
Cryptocurrencies 8 min read

How to Choose Optimal Time Frames for Crypto Trading

28 Jun, 2024
A stack of cryptocurrency coins, including Bitcoin, Ethereum, and Binance Coin, placed on a trading screen displaying market data. Examining the pros and cons of weekend crypto trading.
Cryptocurrencies 8 min read

Should You Trade Cryptocurrency on The Weekends?

27 Jun, 2024
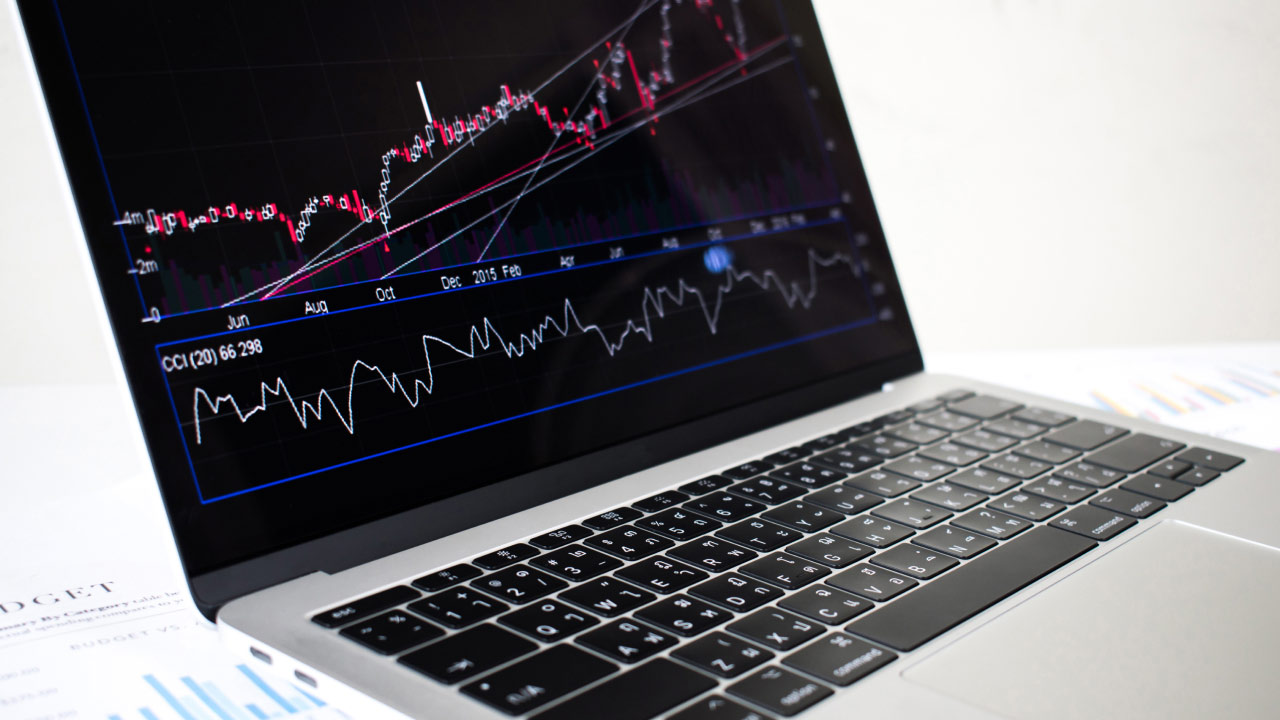
a laptop screen displaying a trading chart with various indicators and timeframes, illustrating how to change timeframes on MT5.
MetaTrader 8 min read

How to Change Time Frames on MT5

27 Jun, 2024
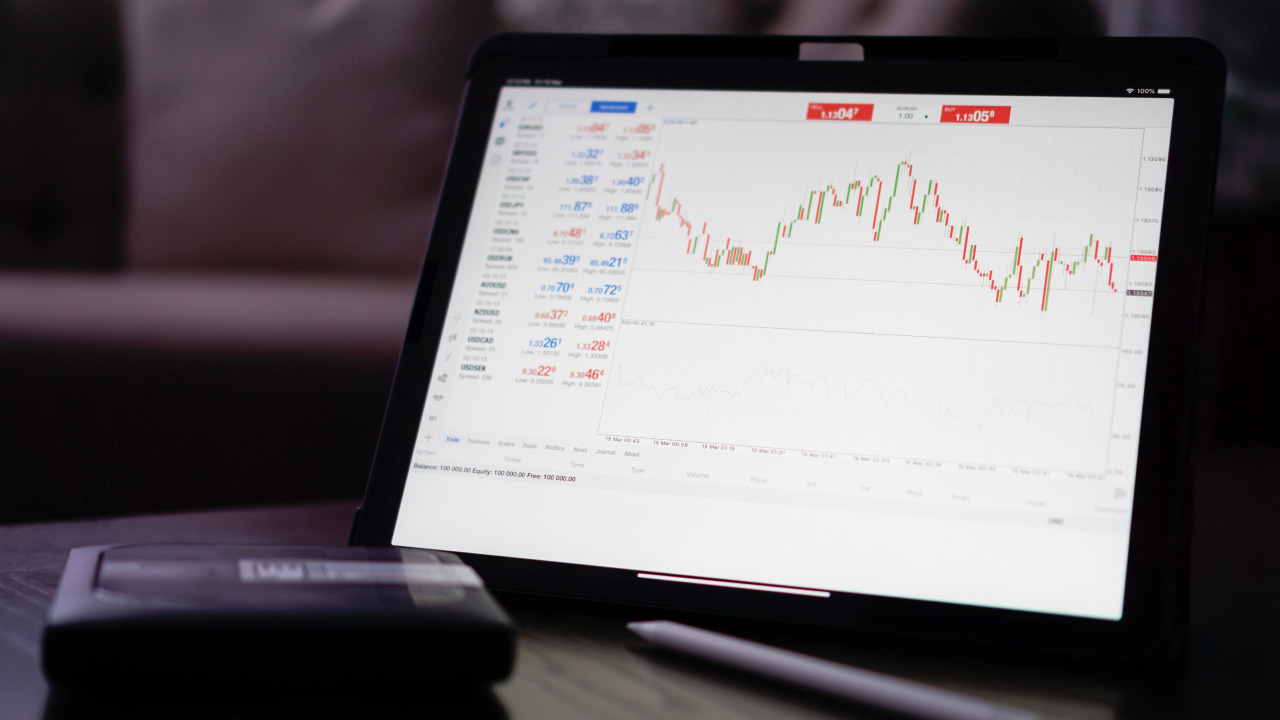
A tablet displaying a trading platform with a candlestick chart and forex price quotes, illustrating how to install expert advisors on MT5 for automated trading strategies.
MetaTrader 10 min read

How to Install Expert Advisors on MT5

27 Jun, 2024
Jon Kibbler with the text title "Don't Trade EUR/AUD Until You See This" and the date 26/06/2024, illustrating a trading idea for the EUR/AUD currency pair.
Daily Forex Analysis 8 min read

Don't Trade EUR/AUD Until You See This

26 Jun, 2024
An oil field with pumpjacks operating at sunset, illustrating the relationship between oil prices and the stock market, as fluctuations in crude oil impact global financial markets.
Commodities 8 min read

How Do Oil Prices Affect the Stock Market?

26 Jun, 2024
a smartphone displaying a 3D candlestick chart with green and red bars, representing market fluctuations and implied volatility influenced by factors such as market sentiment, supply and demand, and economic events.
Trading Strategies 8 min read

What Is Implied Volatility & Factors Affecting it?

26 Jun, 2024
 A person holding a smartphone displaying the MetaTrader 5 (MT5) demo account registration screen, showing the process of how to create a demo account on MT5 for simulated trading.
MetaTrader 8 min read

How to Create a Demo Account on MT5

24 Jun, 2024
a  financial analysis graphic titled "Weekly Forex Trading Ideas: 24th June" featuring a blueberry illustration, symbolizing fresh insights. The text "Week Ahead Analysis" and the date "June 24th | 2024" are prominently displayed, offering a preview of key forex trading opportunities for the week.
Week Ahead 8 min read

Weekly Forex Trading Ideas: 24th June

23 Jun, 2024
A financial graphic titled "How CoT Reports Could Predict a CAD Rally" depicting a significant market reversal with the text "Huge Reversal Pending On Canadian Dollar." The image highlights a trading idea focused on the potential rally of the Canadian Dollar, emphasizing the importance of Commitment of Traders (CoT) reports in forecasting market movements.
Daily Forex Analysis 8 min read

How CoT Reports Could Predict a CAD Rally

19 Jun, 2024
A financial analysis graphic titled "Weekly Forex Trading Analysis: 17th June-21st June" featuring a blueberry illustration, symbolizing fresh insights. The text "Week Ahead Analysis" and the date "June 17th | 2024" are prominently displayed, offering a preview of key forex trading opportunities for the week.
Week Ahead 8 min read

Weekly Forex Trading Analysis: 17th June-21st June

16 Jun, 2024
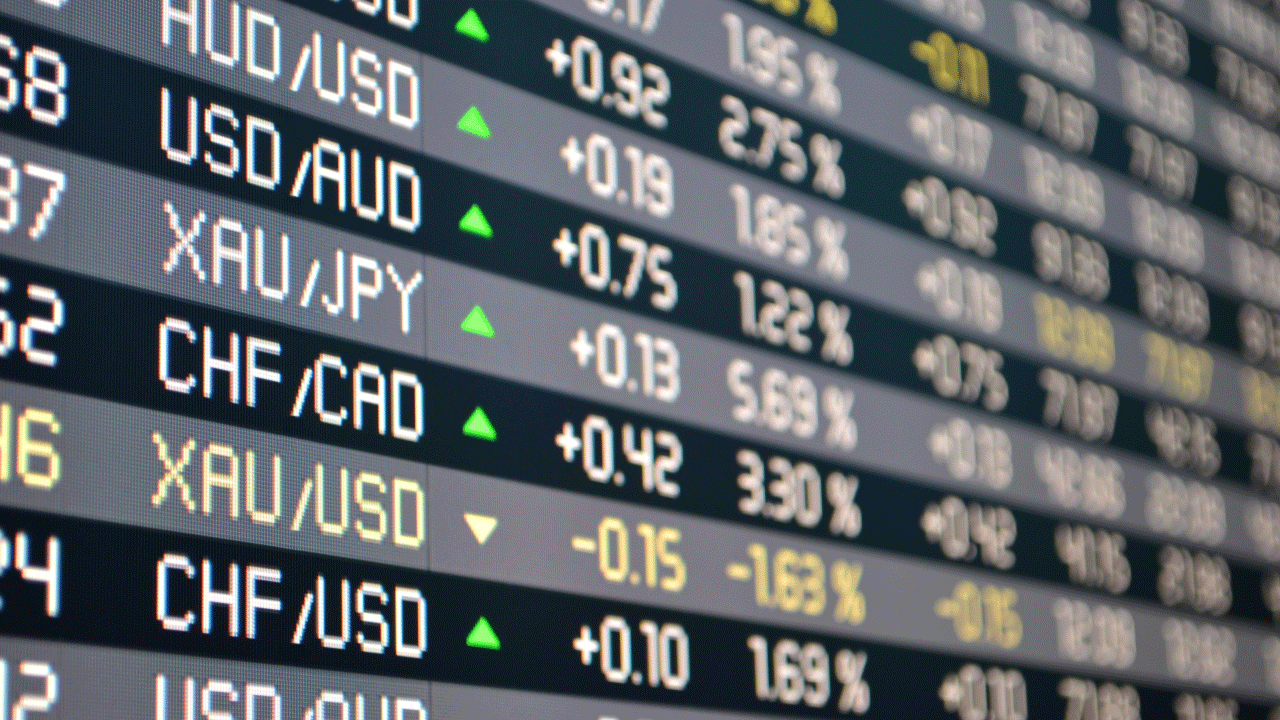
digital display showing live forex exchange rates for currency pairs
Forex 6 min read

Benefits and Risks of investing in the Tokyo Stock Exchange from Vietnam

13 Jun, 2024
An image of the MetaTrader 5 mobile app interface with the text "MetaTrader 5" and "BUSINESS" displayed. The graphic provides a guide on how to use the MetaTrader 5 mobile app for trading, highlighting its features and functionality for business and financial activities.
MetaTrader 6 min read

How To Use MetaTrader 5 Mobile App

07 Jun, 2024
illustration on how to use a risk-reward calculator, featuring numerical and textual elements. The graphic provides a step-by-step guide on utilizing a risk-reward calculator for trading, emphasizing its importance in financial decision-making.
Trading Strategies 8 min read

How to Use a Risk-Reward Calculator

06 Jun, 2024
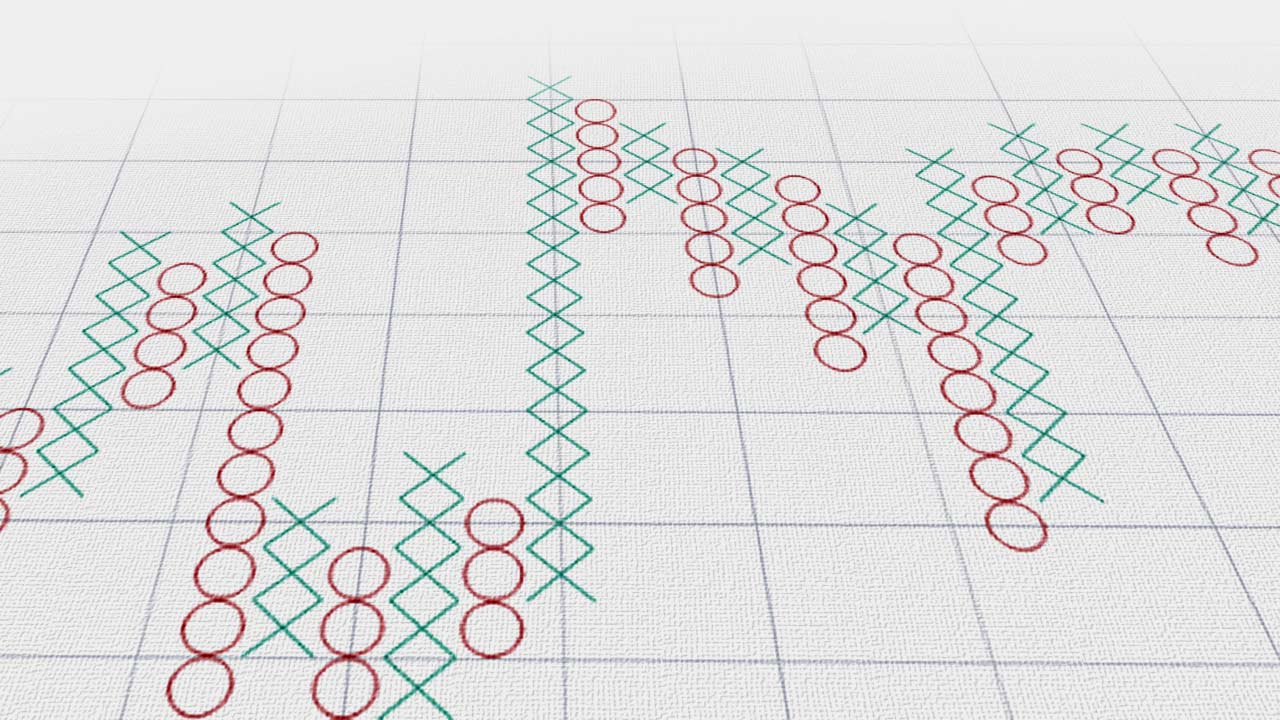
An educational image titled "How to Trade With Point-and-Figure (P&F) Charts?" featuring a diagram with labeled elements. The graphic provides a guide on using Point-and-Figure charts for trading, illustrating key concepts and techniques to analyze market trends and make informed trading decisions.
Trading Strategies 8 min read

How to Trade With Point-and-Figure (P&F) Charts?

06 Jun, 2024
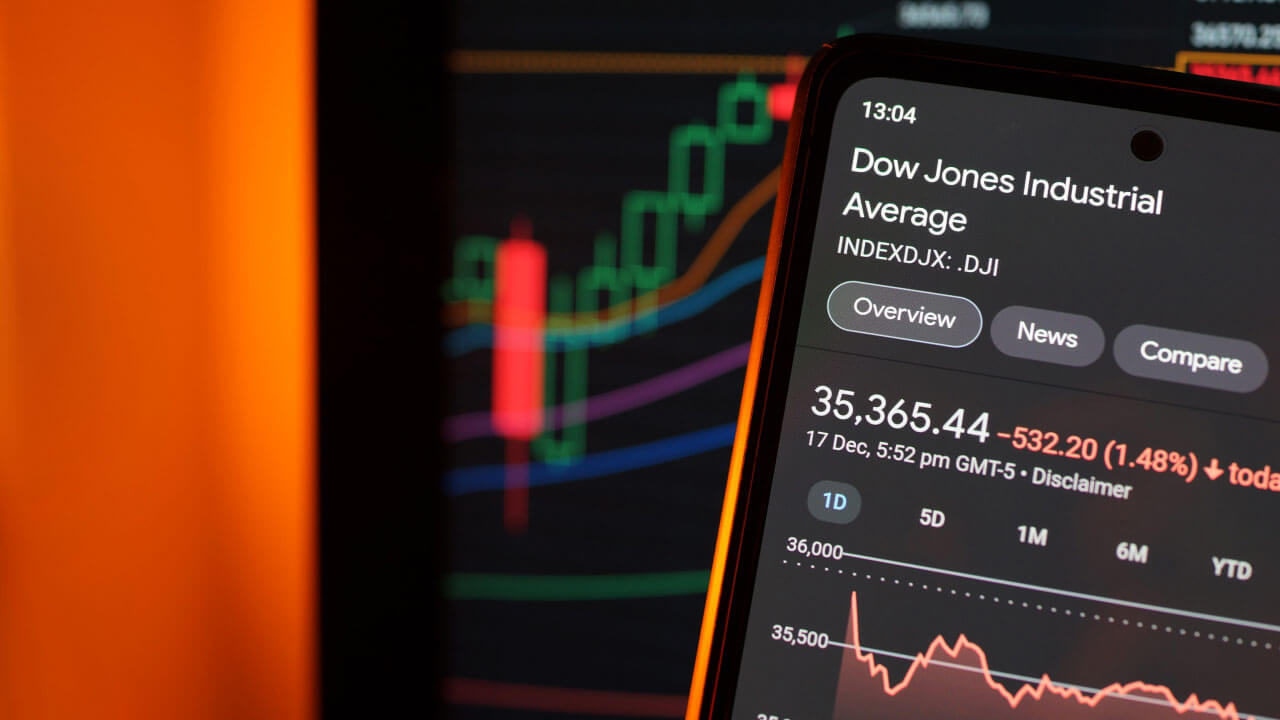
Understanding the Dow Jones Index: A Beginner's Guide featuring real-time stock market data and candlestick charts.
Trading Strategies 5 min read

Understanding the Dow Jones Index: A Beginner's Guide

06 Jun, 2024
Trader holding a phone in front of a monitor, illustrating ECB poised to cut interest rates
Daily Forex Analysis 8 min read

ECB Poised to Cut Interest Rates

05 Jun, 2024
a confident female trader in glasses giving a thumbs-up in front of multiple monitors
Trading Strategies 8 min read

How to Keep Trading Overconfidence in Check

05 Jun, 2024
a trader analyzing financial charts on multiple screens in a dimly lit room
Trading Strategies 8 min read

How To Find A Trading Style That Suits You

04 Jun, 2024
different currencies in grey background
Forex 8 min read

How Forex Brokers Manage Risks

03 Jun, 2024
An image of a digital globe with yen and dollar symbols, illustrating Forex Trading Week Ahead: 3rd June.
Week Ahead 9 min read

Forex Trading Week Ahead: 3rd June

02 Jun, 2024
a digital financial chart with candlestick patterns in green and red, showing market trends
Trading Strategies 8 min read

How to Use Pivot Points for Range Trading

30 May, 2024
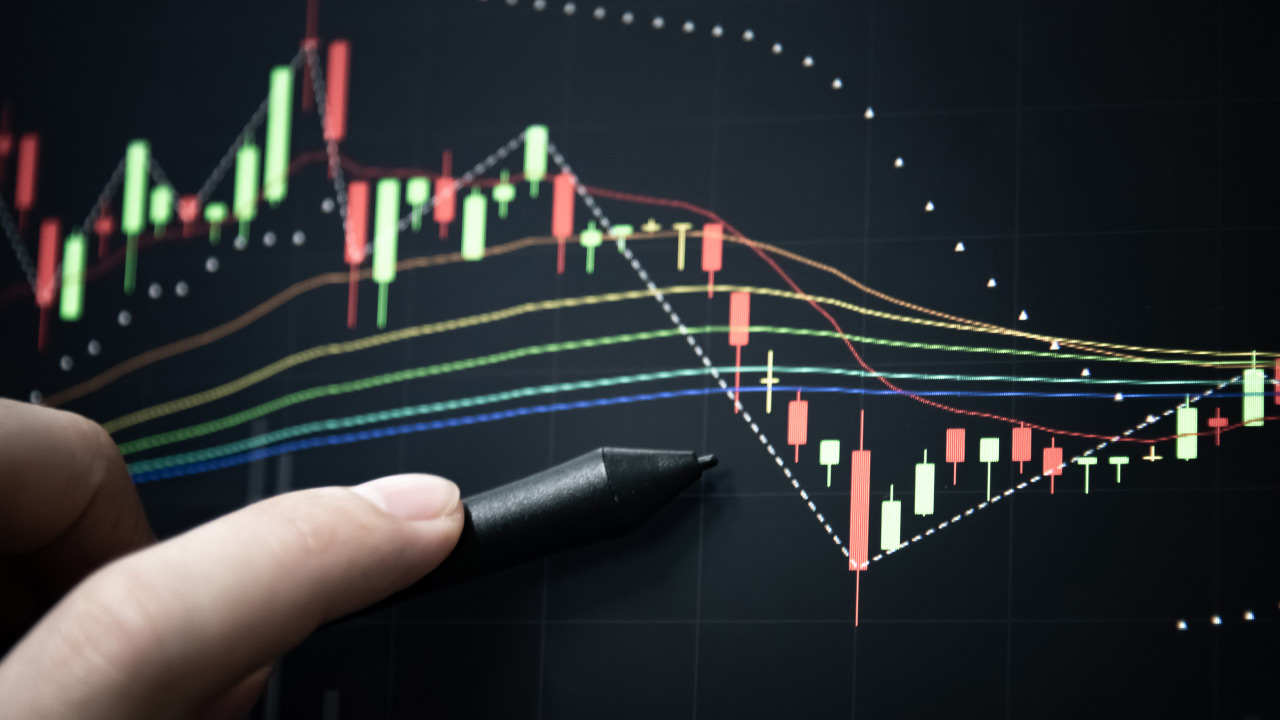
a hand pointing to a financial trading chart on a screen
Trading Strategies 6 min read

How to Trade With Guppy Multiple Moving Average (GMMA)

30 May, 2024
Mobile phone showing a trading chart, illustrating Donald Trump found guilty while FX remains unchanged
Daily Forex Analysis 5 min read

Donald Trump Found Guilty- FX Unchanged

30 May, 2024
Why is silver the undervalued commodity? A financial analyst discusses commodity investments, with gold and copper marked as good investments and silver highlighted with a red cross, indicating its overlooked value.
Daily Forex Analysis

Why Silver is the Undervalued Commodity

29 May, 2024
5 Exit Strategies to Consider in Forex Trading. A high-tech trading setup displaying forex market charts, with traders analyzing price movements on multiple screens, representing strategic exit planning in forex trading.
Forex 7 min read

5 Exit Strategies To Consider in Forex Trading

28 May, 2024
EUR/USD Price Forecast 2024 – A 3D-rendered financial concept featuring bold golden EUR/USD text with red and green candlestick chart elements on a dark reflective surface.
Forex

EUR/USD Price Forecast 2024: What to Expect

28 May, 2024
A person holding a Bitcoin coin in one hand while using a smartphone displaying the MetaTrader 5 logo, with various cryptocurrency coins on a wooden table, representing trading cryptocurrencies with MetaTrader 5.
MetaTrader 8 min read

Trading Cryptocurrencies with MetaTrader 5

28 May, 2024
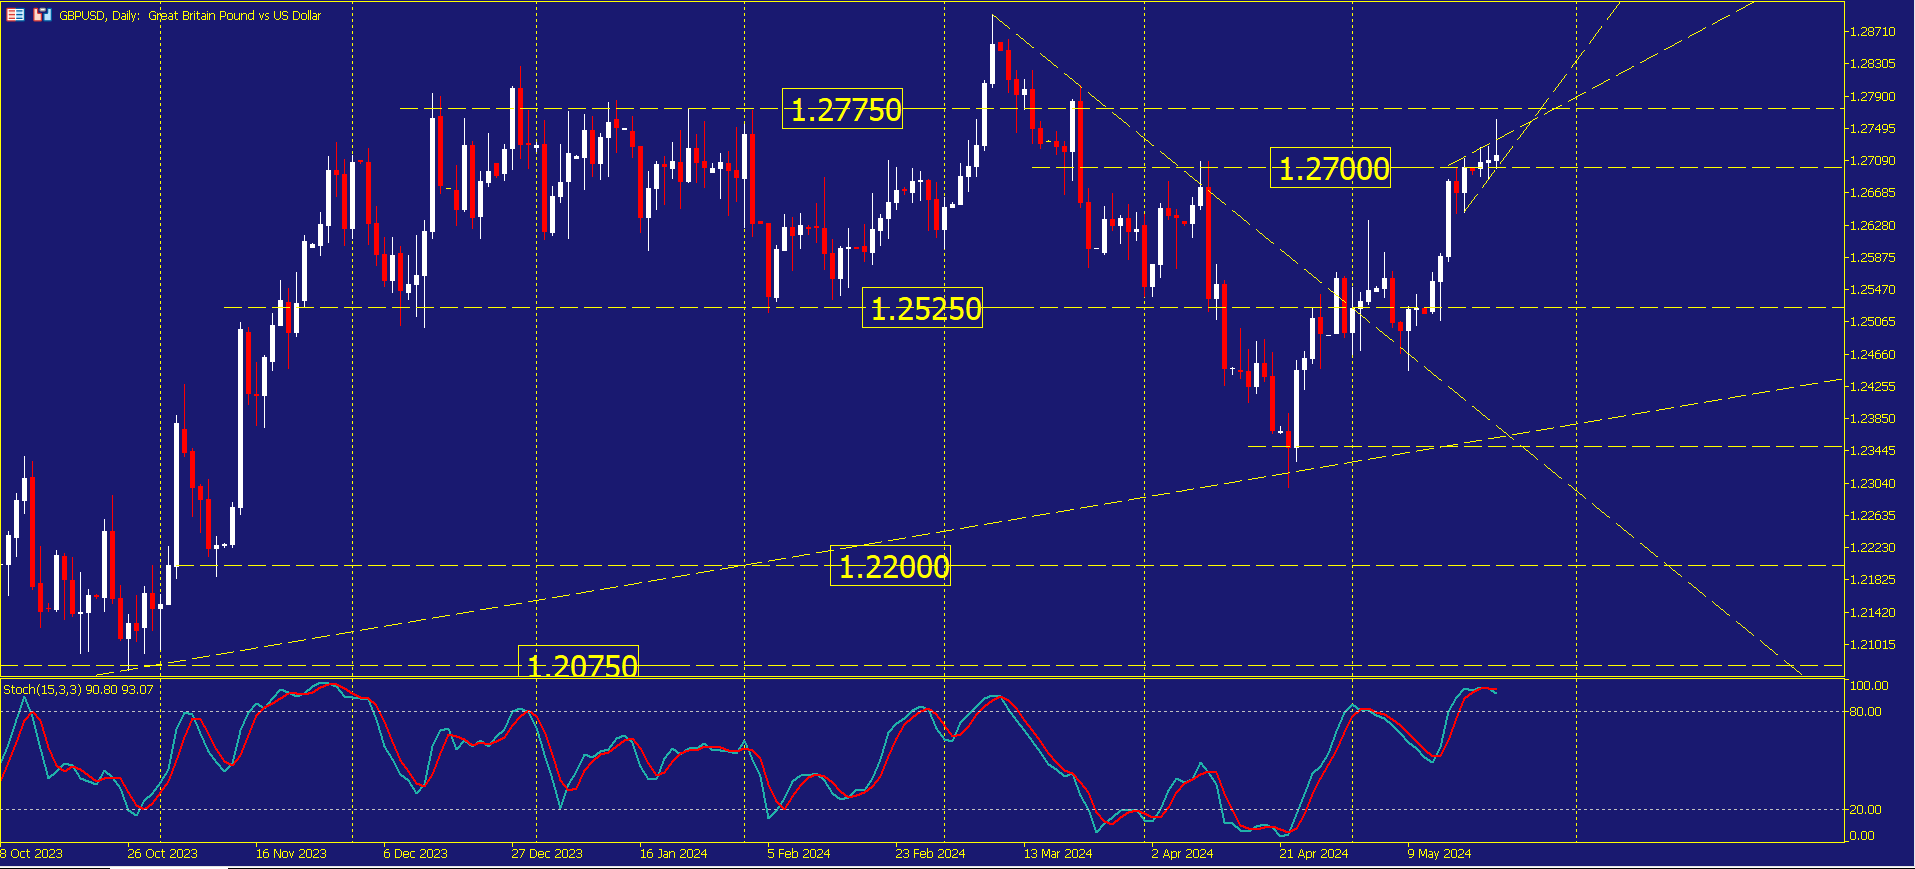
a daily candlestick chart of GBP/USD (British Pound vs US Dollar) showing key support and resistance levels
Daily Forex Analysis

GBP/USD Spikes as UK Inflation Declines to 2.3%

22 May, 2024
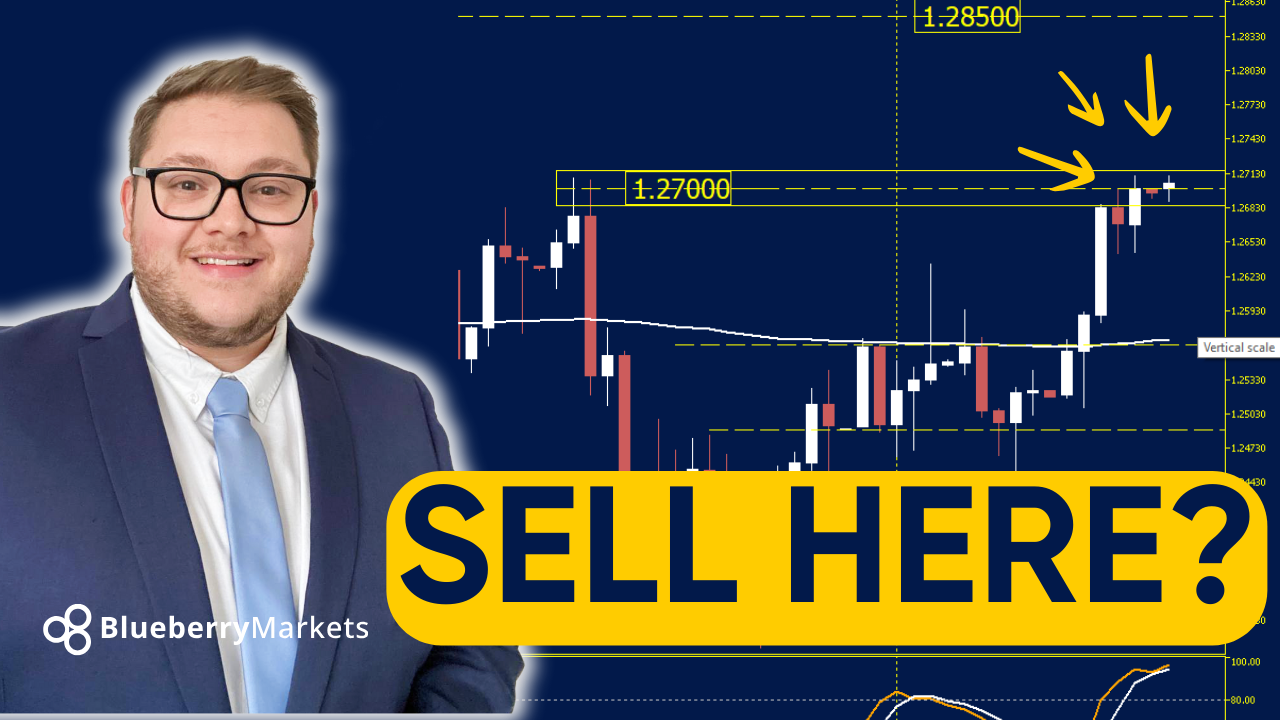
Daily Forex Analysis 4 min read

GBPUSD A Key Pair to Watch This Week for Forex Traders

20 May, 2024
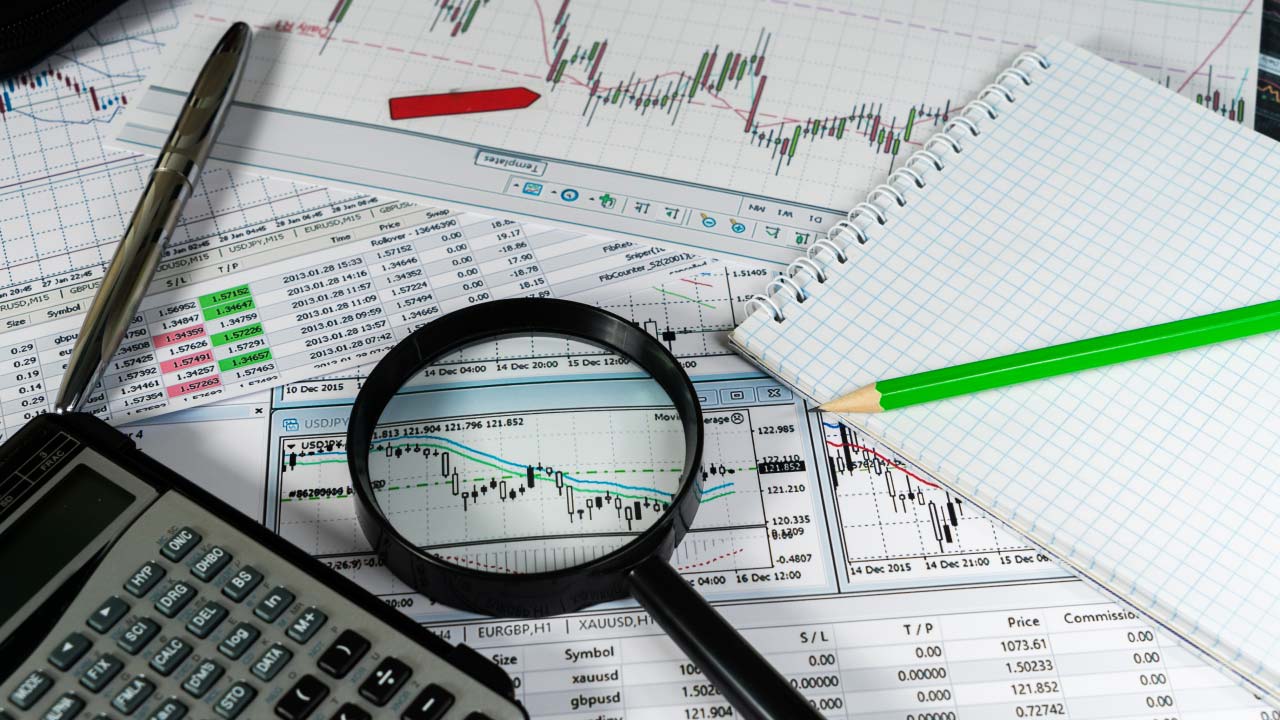
A collection of financial documents, charts, and graphs on a desk, illustrating the concept of a Floating Exchange Rate.
Economic Indicator 7 min read

What is a Floating Exchange Rate?

17 May, 2024
A trader analyzing candlestick charts on a smartphone, representing the process of backtesting a trading strategy using historical price data.
Trading Strategies 6 min read

How to Backtest a Trading Strategy?

17 May, 2024
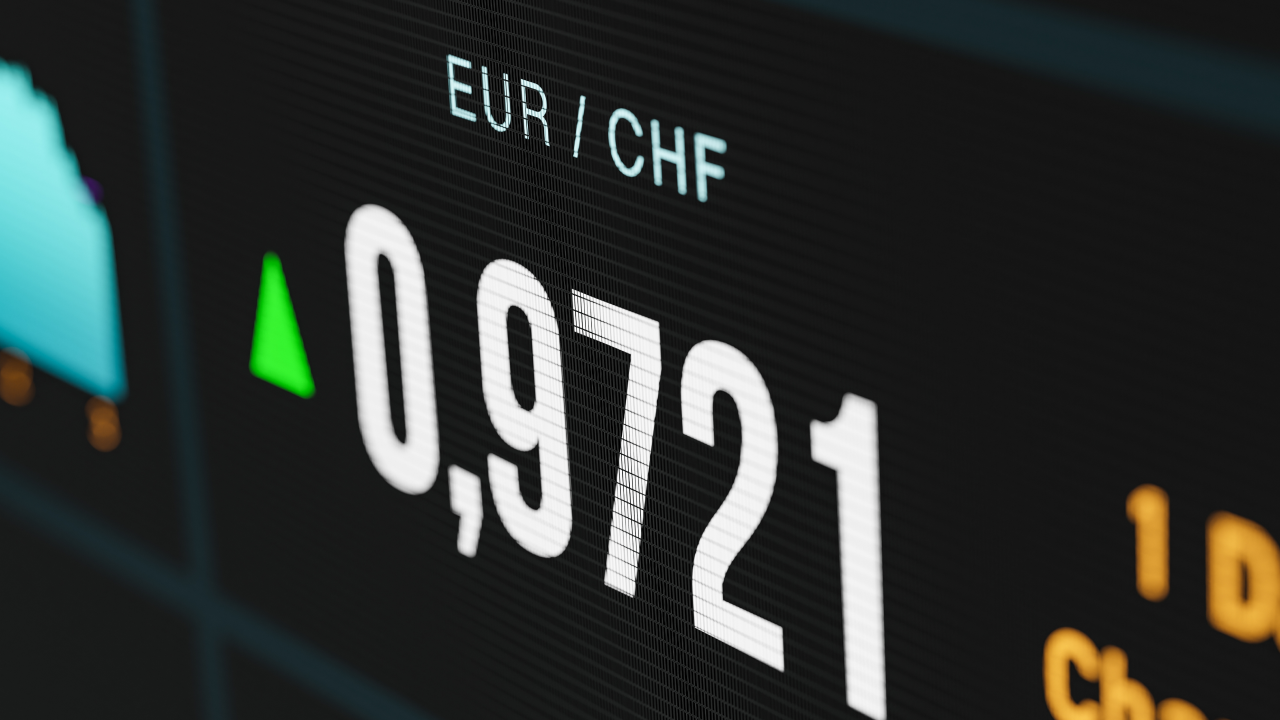
a close-up digital display of the EUR/CHF (Euro/Swiss Franc) currency pair
Forex 6 min read

How to Trade the EUR/CHF

16 May, 2024
GBP/CAD trading concept featuring the United Kingdom and Canada flags with wooden letter blocks spelling 'GBP' and 'CAD' respectively.
Forex 8 min read

How to Trade GBP/CAD?

16 May, 2024
US CPI: A Market Letdown and Its Implications, illustrated by a promotional thumbnail image for a live broadcast by Blueberry Markets featuring US CPI data.
Daily Forex Analysis 3 min read

US CPI: A Market Letdown and Its Implications

15 May, 2024
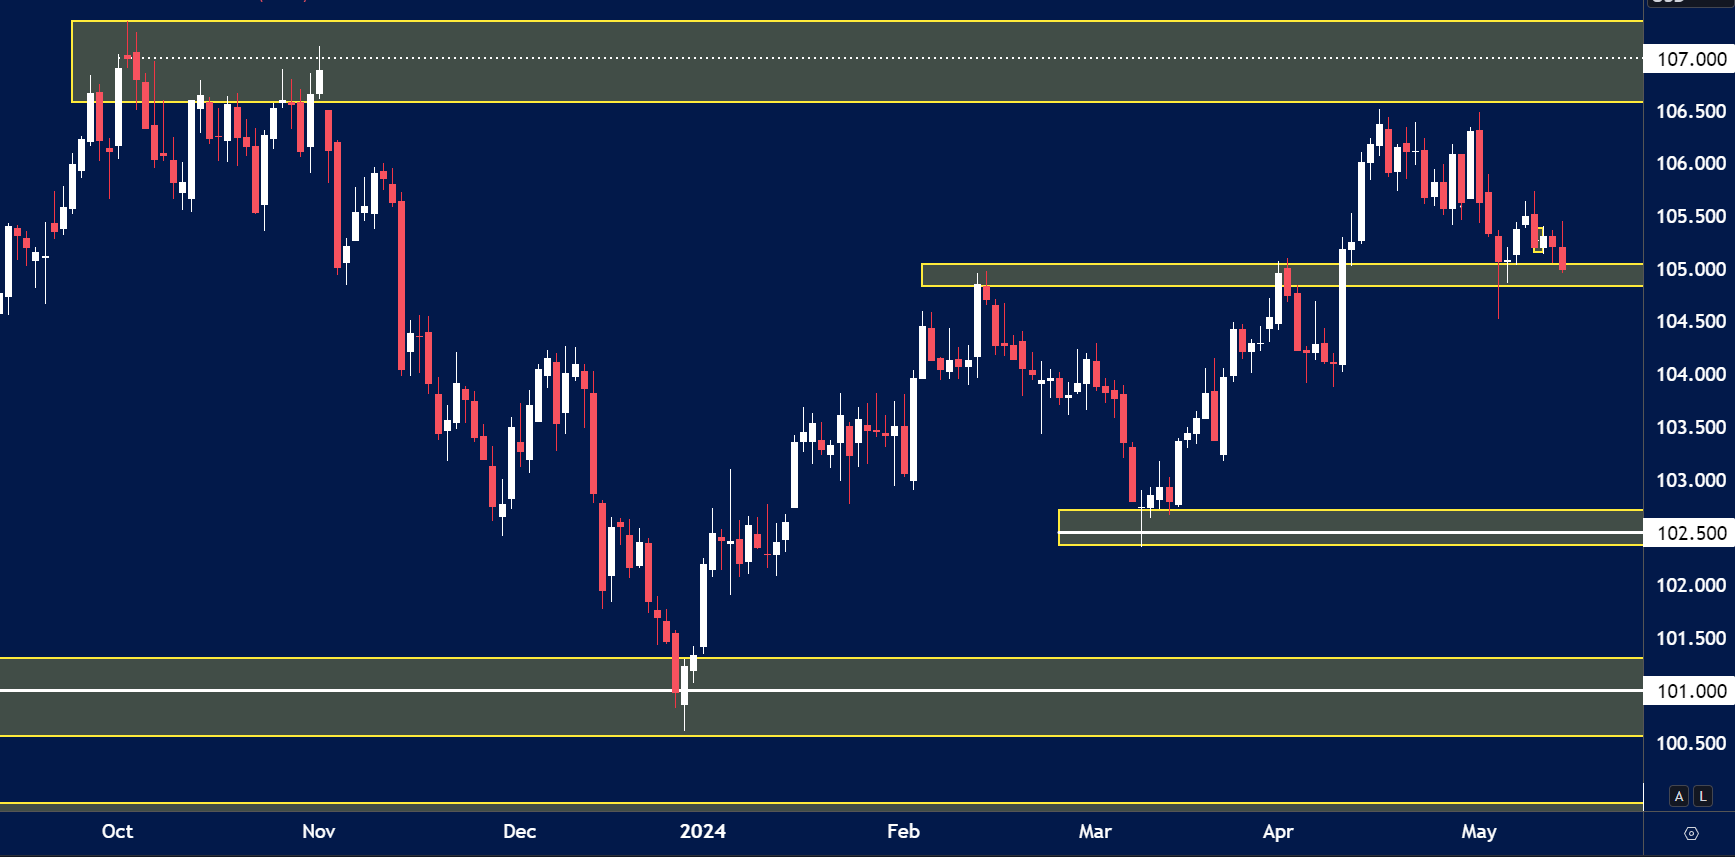
Candlestick chart showing price action from Oct 2023 to May 2024.
Daily Forex Analysis 2 min read

Insights Ahead of US CPI Release

14 May, 2024
Image with bold text reading "AUDUSD SEASONAL SELL?" in large yellow and white letters.
Daily Forex Analysis 5 min read

Sell In May and Go Away

08 May, 2024
calendar with a red pushpin marking a holiday
Trading Strategies 5 min read

How do Bank Holidays Affect Trading Prices?

02 May, 2024

wooden blocks displaying the letters "FOMC" in front of stacks of gold coins
Economic Indicator 6 min read

How Does The FOMC Affect The Market?

02 May, 2024
Australian and Japanese flags merged diagonally, representing the AUD/JPY currency pair in forex trading.
Forex 8 min read

How to Trade AUD/JPY

02 May, 2024
a frustrated male trader sitting at a desk with multiple computer monitors
Trading Strategies 3 min read

How to Bounce Back From a Blown Trading Account

02 May, 2024
a financial chart displaying a bearish candlestick pattern
Trading Strategies 10 min read

How to Use The Dragonfly Doji Candlestick Pattern?

02 May, 2024
To Trade or Fade USDCAD?, illustrated by a financial graphic exploring the decision to trade or fade the USDCAD currency pair.
Daily Forex Analysis 5 min read

To Trade or Fade USDCAD?

29 Apr, 2024
apromotional graphic from Blueberry Markets for "Week Ahead Analysis" dated April 29, 2024.
Week Ahead 5 min read

Forex Week Ahead Analysis: 29th April

28 Apr, 2024
What is the ICT trading strategy? A magnifying glass focusing on a financial chart with candlestick patterns, trend lines, and technical indicators, symbolizing in-depth market analysis using Inner Circle Trader (ICT) concepts.
Trading Strategies 5 min read

What is the ICT trading strategy?

26 Apr, 2024
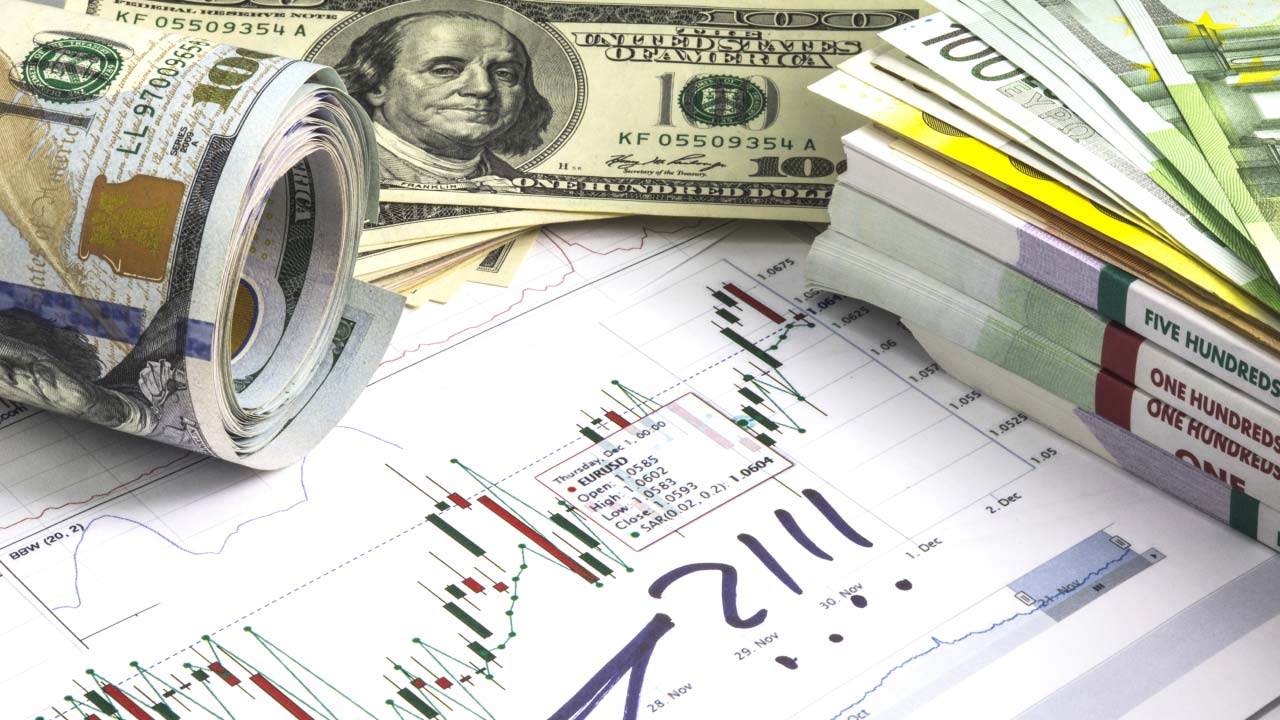
Rolled and stacked US dollar and euro banknotes placed on a forex trading chart displaying candlestick patterns and annotations. What is a Lot in Forex?
Forex 5 min read

What is a Lot in Forex?

26 Apr, 2024
"USDJPY: Can Price Go Any Higher?, illustrating the concept with a focus on the currency pair's bullish momentum and potential for further upward movement."
Daily Forex Analysis 5 min read

USDJPY: Can Price Go Any Higher?

24 Apr, 2024
a promotional graphic from Blueberry Markets for the "Week Ahead Analysis" dated April 22, 2024
Week Ahead 5 min read

Forex Week Ahead Analysis: 22nd April

21 Apr, 2024
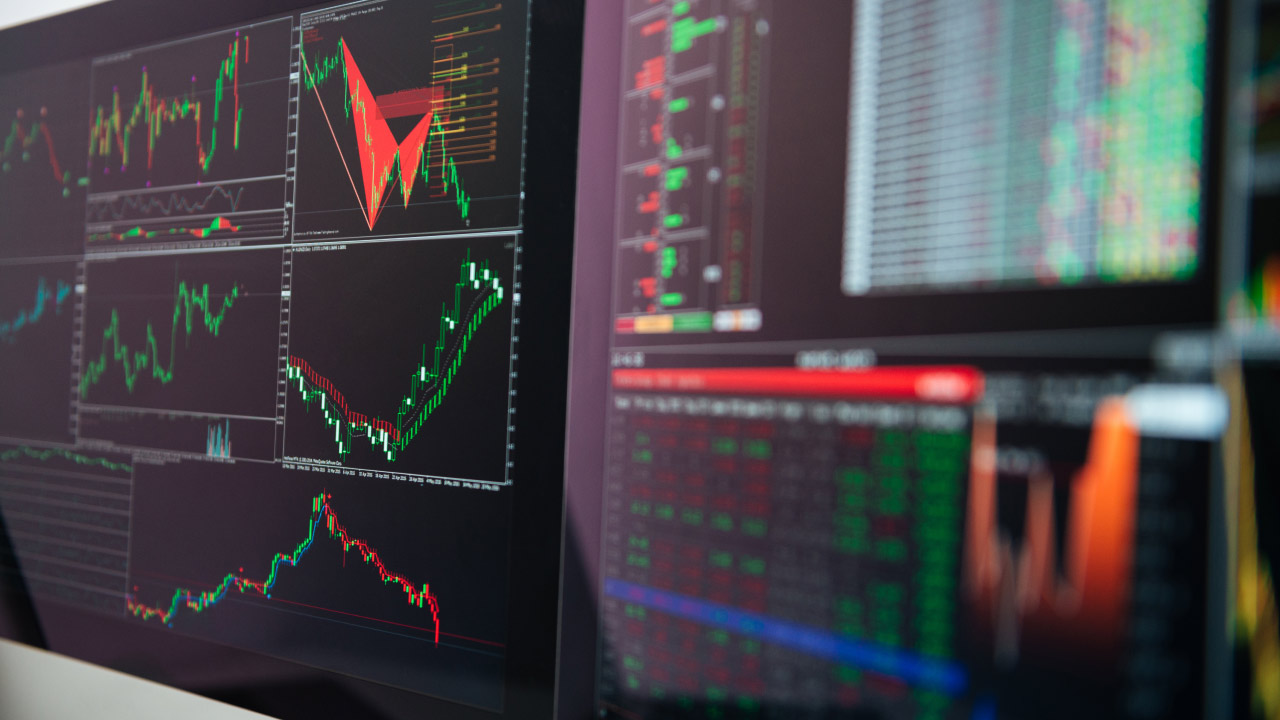
Difference between trading on demo accounts and live accounts – A multi-screen trading setup displaying market charts, price trends, and technical indicators, illustrating the contrast between simulated and real trading environments.
Trading Strategies 5 min read

Difference Between Trading on Demo Accounts and Live Accounts

19 Apr, 2024
Reasons Why New Traders Give up Too Early, illustrated by a man in his trading room holding his face in frustration, surrounded by screens displaying forex charts and trading losses.
Trading Strategies 8 min read

Reasons Why New Traders Give up Too Early

19 Apr, 2024
promotional image from Blueberry Markets featuring Jonathan Kibbler
Daily Forex Analysis 3 min read

GBPUSD Traders Be Aware

17 Apr, 2024
stacks of coins are placed beside a transparent globe
Economic Indicator 8 min read

The Complete Guide to Global Financial Regulatory Bodies

17 Apr, 2024
a frustrated trader with their head in their hands, sitting in front of a computer
Trading Strategies 5 min read

How to Overcome Trading Anxiety

16 Apr, 2024
Top Financial Regulatory Bodies in Europe, illustrated by a blue European Union flag with yellow stars.
Economic Indicator 8 min read

Top Financial Regulatory Bodies in Europe

16 Apr, 2024
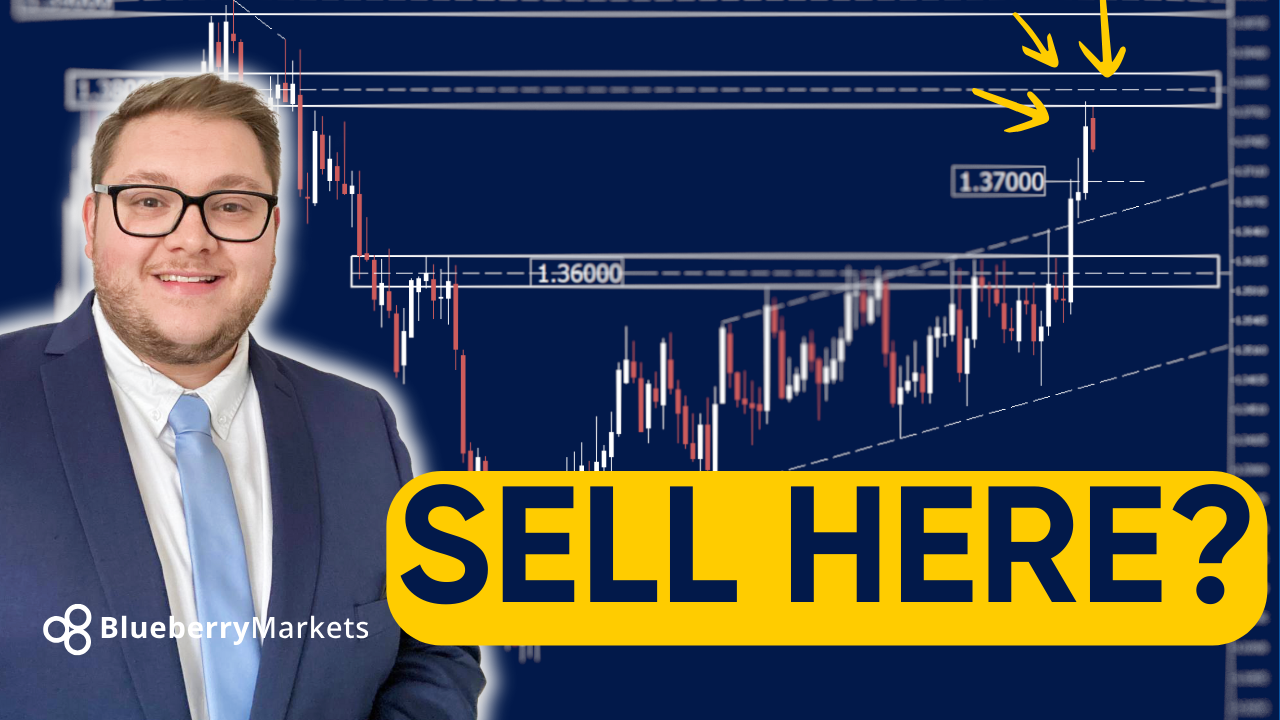
"USDCAD Outlook Amidst Diverging Central Bank Policies, illustrated by a promotional trading graphic from Blueberry Markets featuring Jonathan Kibbler."
Daily Forex Analysis 5 min read

USDCAD Outlook Amidst Diverging Central Bank Policies

15 Apr, 2024
A person calculating taxes with a white calculator while taking notes in a notebook, representing forex traders preparing their taxes in 2024.
Forex 8 min read

How to Prepare Your Taxes as a Forex Trader in 2024

15 Apr, 2024
Promotional graphic from Blueberry Markets for a "Week Ahead Analysis" dated April 15th, illustrating Forex Week Ahead Analysis: 15th April.
Week Ahead 8 min read

Forex Week Ahead Analysis: 15th April

14 Apr, 2024
Keeping an Eye on USDCHF Amidst Central Bank Moves and Economic Data — USDCHF Technical Outlook banner featuring the old Blueberry Markets logo, with a background of a forex chart showing price movement, economic data icons, and central bank imagery.
Daily Forex Analysis 2 min read

Keeping an Eye on USDCHF Amidst Central Bank Moves and Economic Data

09 Apr, 2024
Week Ahead 3 min read

Forex Week Ahead Analysis: 8th April

08 Apr, 2024
a digital graphic displaying the words "GOLD Technical Outlook"
Daily Forex Analysis 3 min read

Gold Rallies Amidst Rising US Bond Yields: A Technical Outlook

03 Apr, 2024
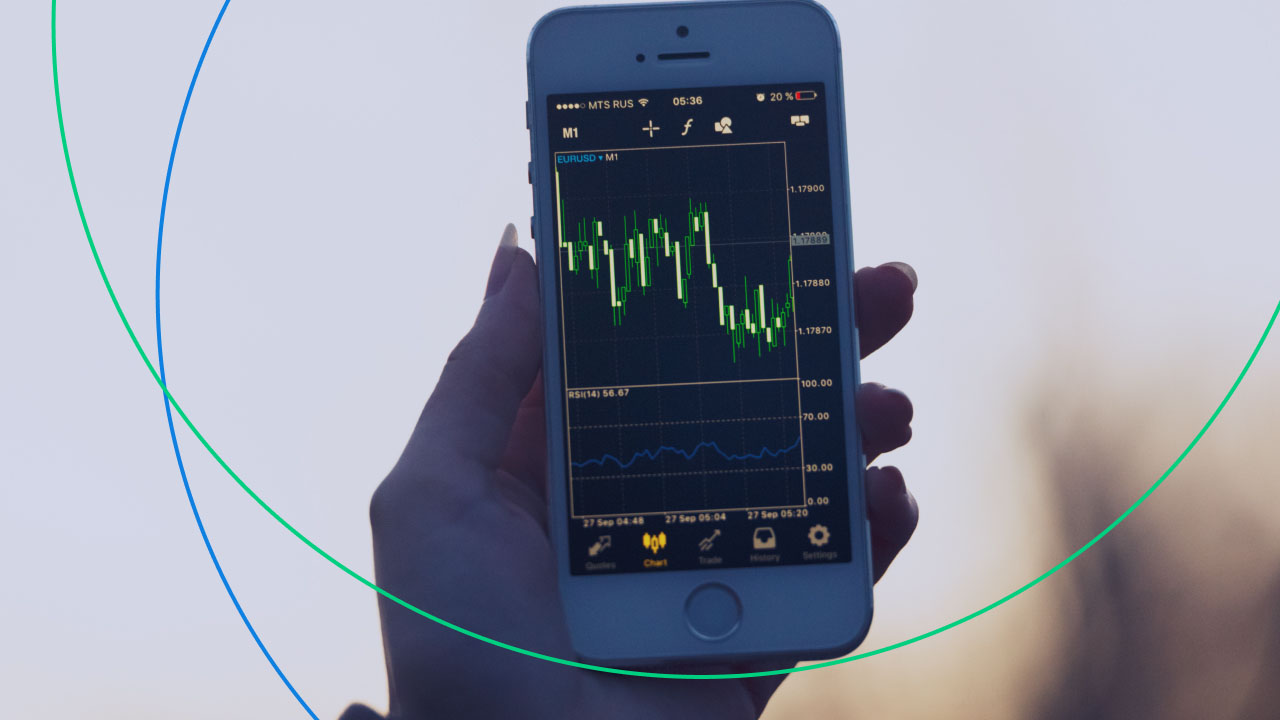
a person holding a smartphone displaying a forex trading chart for the EUR/USD currency pair
Trading Strategies 5 min read

5 Ways to Start Forex Trading As a Beginner

02 Apr, 2024
 digital graphic with a dark blue background displaying "April 1st Week Ahead Analysis"
Week Ahead 3 min read

Forex Week Ahead Analysis: 1st April

01 Apr, 2024
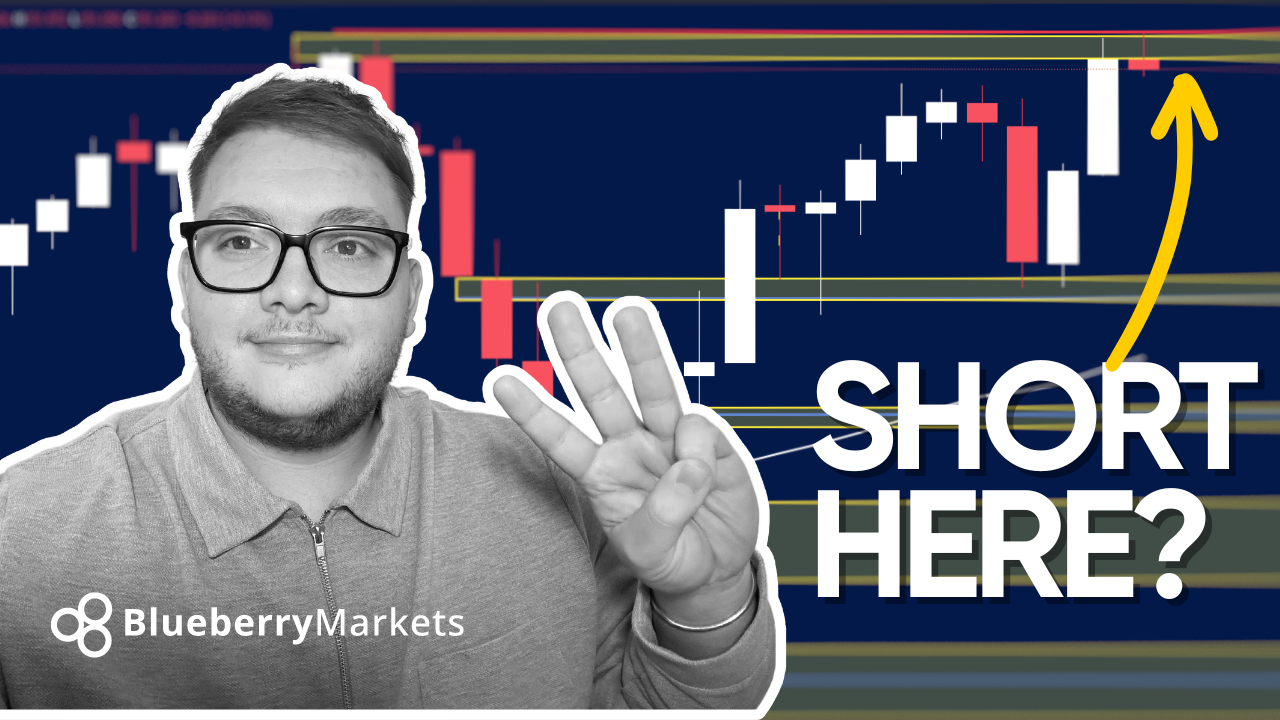
Understanding Japan's Stance on JPY Weakening, illustrated by Jon Kibbler holding up three fingers with a financial chart in the background.
Daily Forex Analysis 3 min read

Understanding Japan's Stance on JPY Weakening

27 Mar, 2024
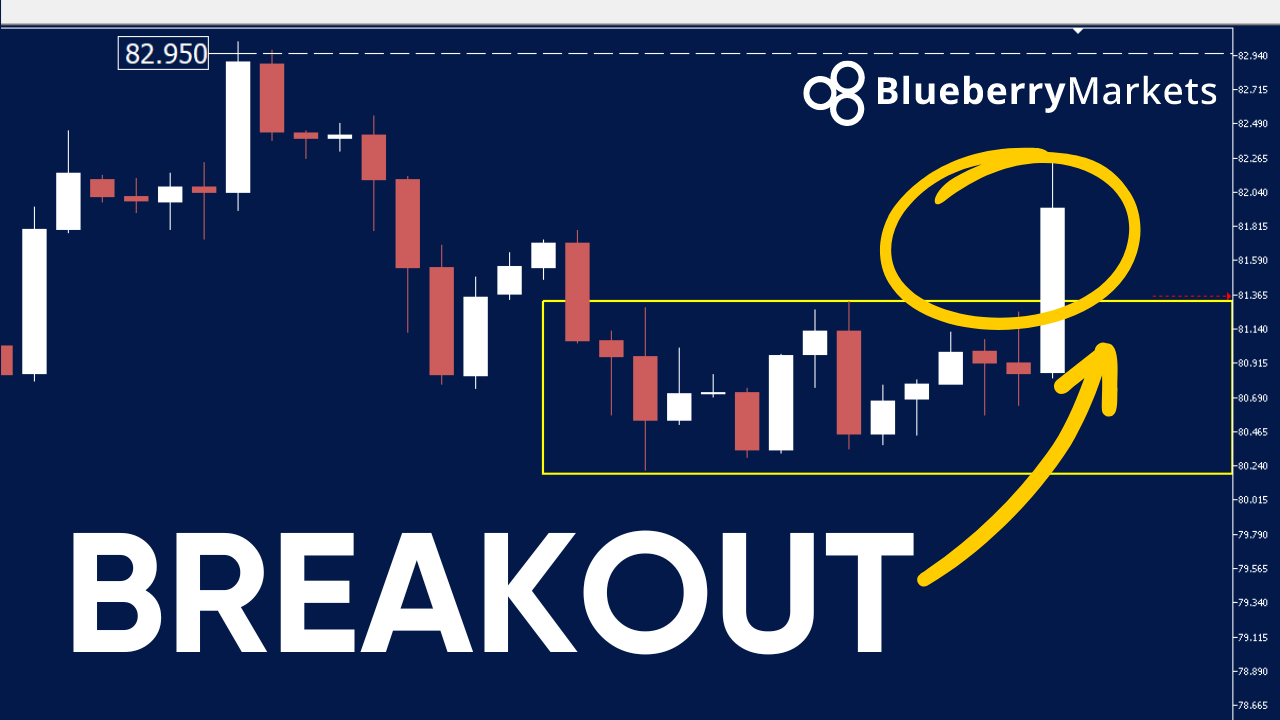
A forex candlestick chart showing a breakout pattern, illustrating WTI Crude Oil set to trade to \$100.00?
Daily Forex Analysis 3 min read

WTI Crude Oil Set to Trade to $100.00?

26 Mar, 2024
Navigating the Forex Markets: A Quieter Week Ahead, illustrated by an image with the text "Blueberry Markets March 25th Week Ahead Analysis".
Daily Forex Analysis 3 min read

Navigating the Forex Markets: A Quieter Week Ahead

25 Mar, 2024
a Blueberry Markets analysis thumbnail featuring Jon Kibbler pointing upwards
Daily Forex Analysis 3 min read

How To Trade GBPUSD Fundamentals

21 Mar, 2024
USD In Focus Ahead Of Fed Announcement, illustrated by a financial news-style thumbnail from Blueberry Markets discussing inflation.
Daily Forex Analysis 3 min read

USD In Focus Ahead Of Fed Announcement

20 Mar, 2024
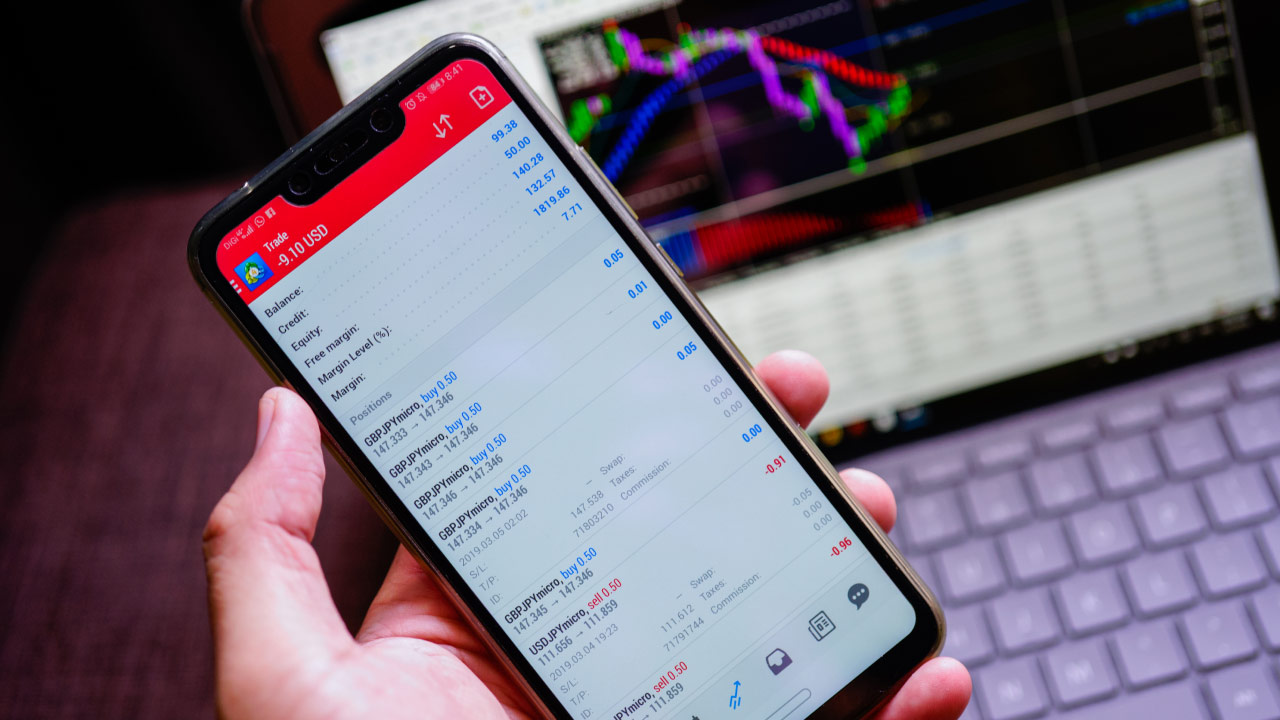
Optimizing MT4 and MT5 Performance with VPS: Configuration Tips and Tricks, illustrated by a person holding a smartphone displaying a trading app with a live account balance.
MetaTrader 5 min read

Optimizing MT4 and MT5 Performance with VPS: Configuration Tips and Tricks

19 Mar, 2024
e image has a dark blue background with white and yellow text that says "Blueberry Markets Week Ahead Analysis for March 18th"
Week Ahead 3 min read

Forex Week Ahead Analysis: 18th March

18 Mar, 2024
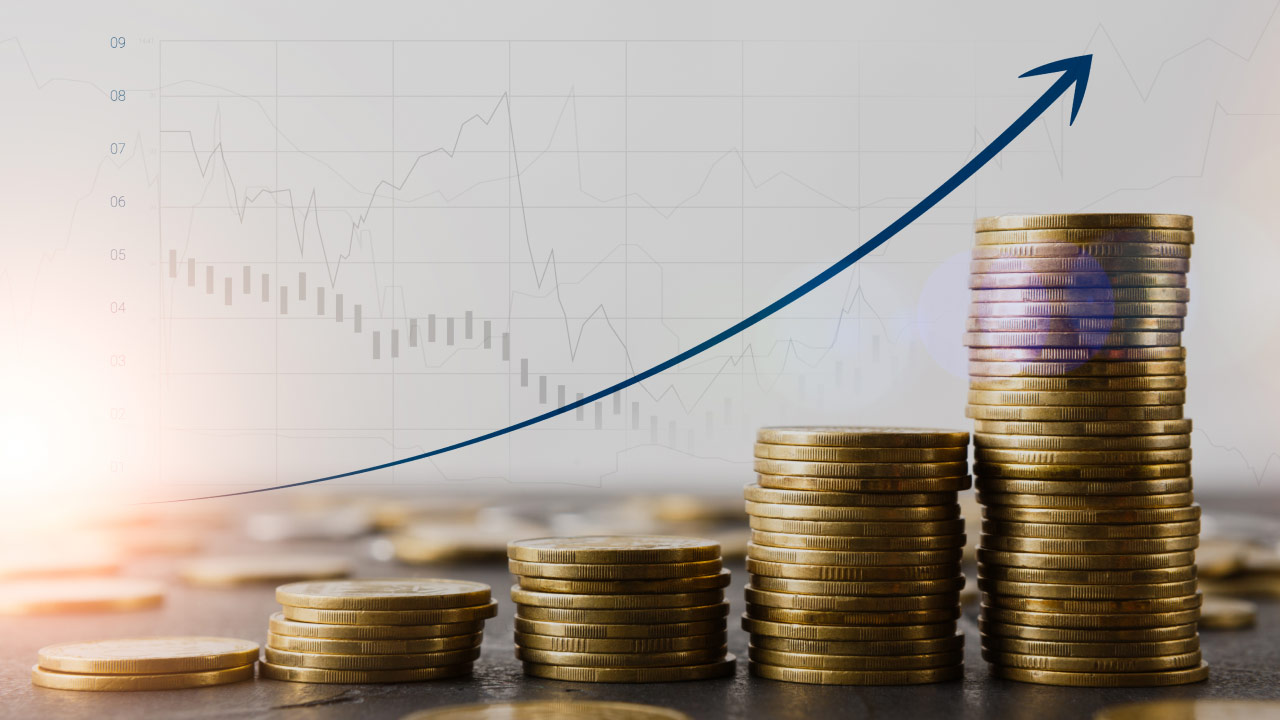
Common Mistakes to Avoid When Making Forex Deposits – Stacks of gold coins increasing in height with an upward trend arrow, symbolizing financial growth, against a background of forex market charts.
Forex 3 min read

Common Mistakes to Avoid When Making Forex Deposits

18 Mar, 2024
a man in a casual blue shirt is sitting at a desk in a modern home office
Forex 5 min read

How to Transition from a Demo Account to a Live Account

18 Mar, 2024
 promotional graphic from Blueberry Markets for a "Week Ahead Analysis" dated March 18th
Week Ahead 5 min read

Forex Week Ahead Analysis: 18th March | Central Bank Rate Announcements in Focus

17 Mar, 2024
Why do forex brokers charge commission fees? A financial analyst in a suit explains forex charts on multiple monitors, highlighting trading costs and broker fees in a professional office setting.
Forex 5 min read

Why Do Forex Brokers Charge Commission Fees?

13 Mar, 2024
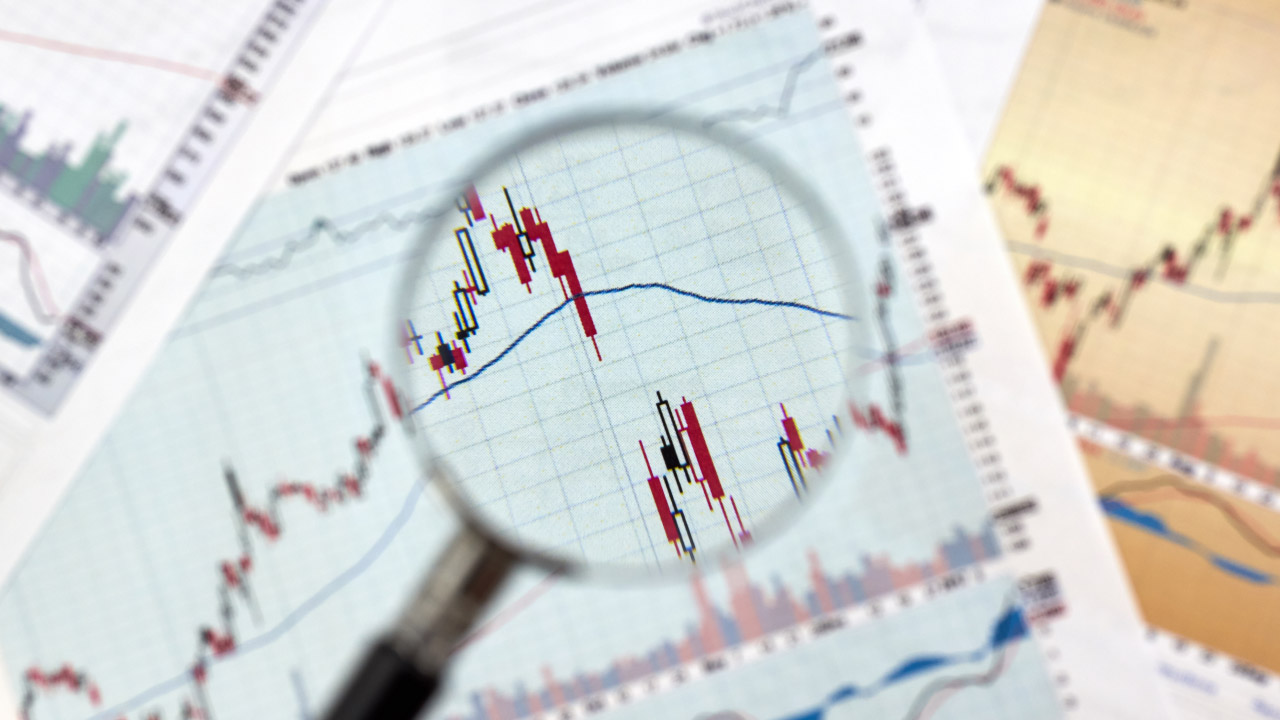
Magnifying glass focusing on a forex candlestick chart with a price gap, highlighting top gap trading strategies in financial markets.
Trading Strategies 6 min read

Top Gap Trading Strategies

12 Mar, 2024
A businessman in a suit analyzing financial documents at his desk with a laptop, illustrating demo accounts, setting goals, and establishing rules
Forex 4 min read

Demo Accounts: Setting Goals and Establishing Rules

12 Mar, 2024
A thumbnail image for a Blueberry Markets video or article about USD/JPY price movement, illustrating the recent plunge of USDJPY and questioning if further decline is imminent
Daily Forex Analysis 4 min read

Exploring the Recent Plunge of USDJPY: Is Further Decline Imminent?

11 Mar, 2024
A banner with yen and dollar signs and text referencing the title, illustrating Forex Week Ahead Analysis: 11th March.
Week Ahead 5 min read

Forex Week Ahead Analysis: 11th March

11 Mar, 2024
a smiling businessman in a suit holding a smartphone, sitting at his desk
Trading Strategies 5 min read

How to Trade Inside Days

08 Mar, 2024
Passive vs Active Trading: What's the Difference? – Two traders discussing financial charts displayed on multiple screens, analyzing market trends and strategies.
Trading Strategies 5 min read

Passive vs Active Trading: What's the Difference?

08 Mar, 2024
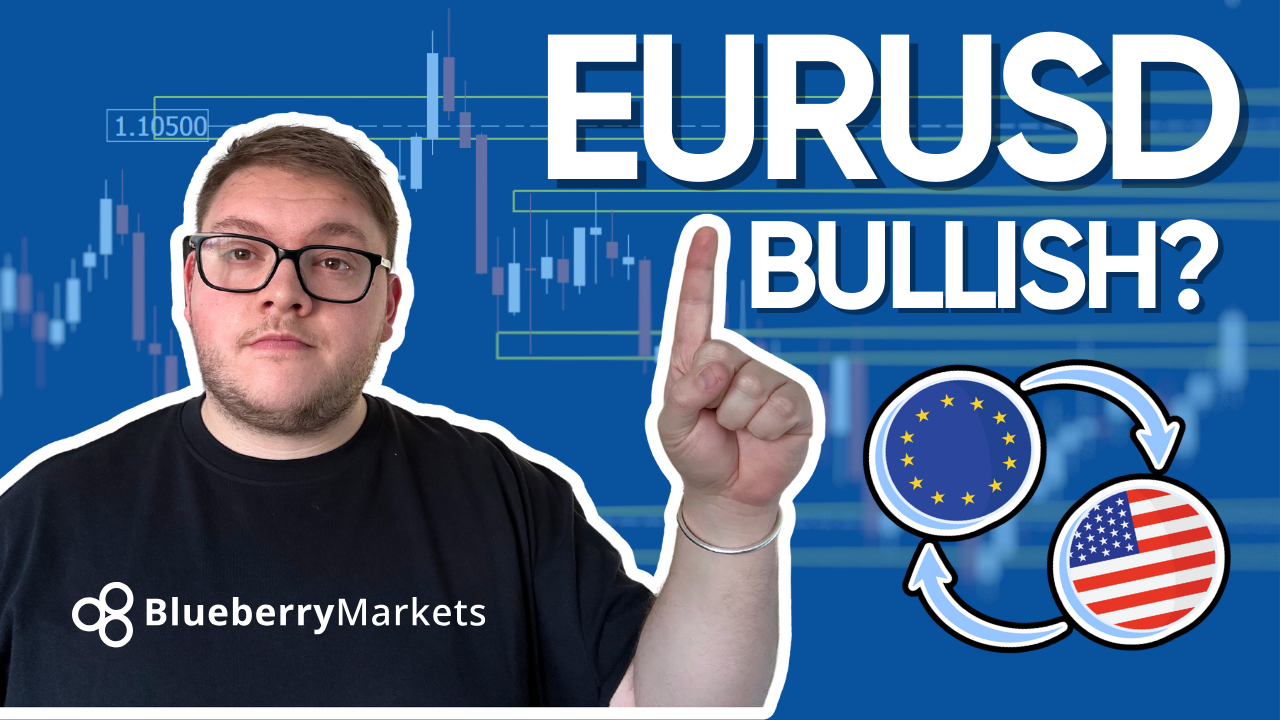
Is EURUSD Bullish In 2024?
Daily Forex Analysis 5 min read

Is EURUSD Bullish In 2024?

06 Mar, 2024
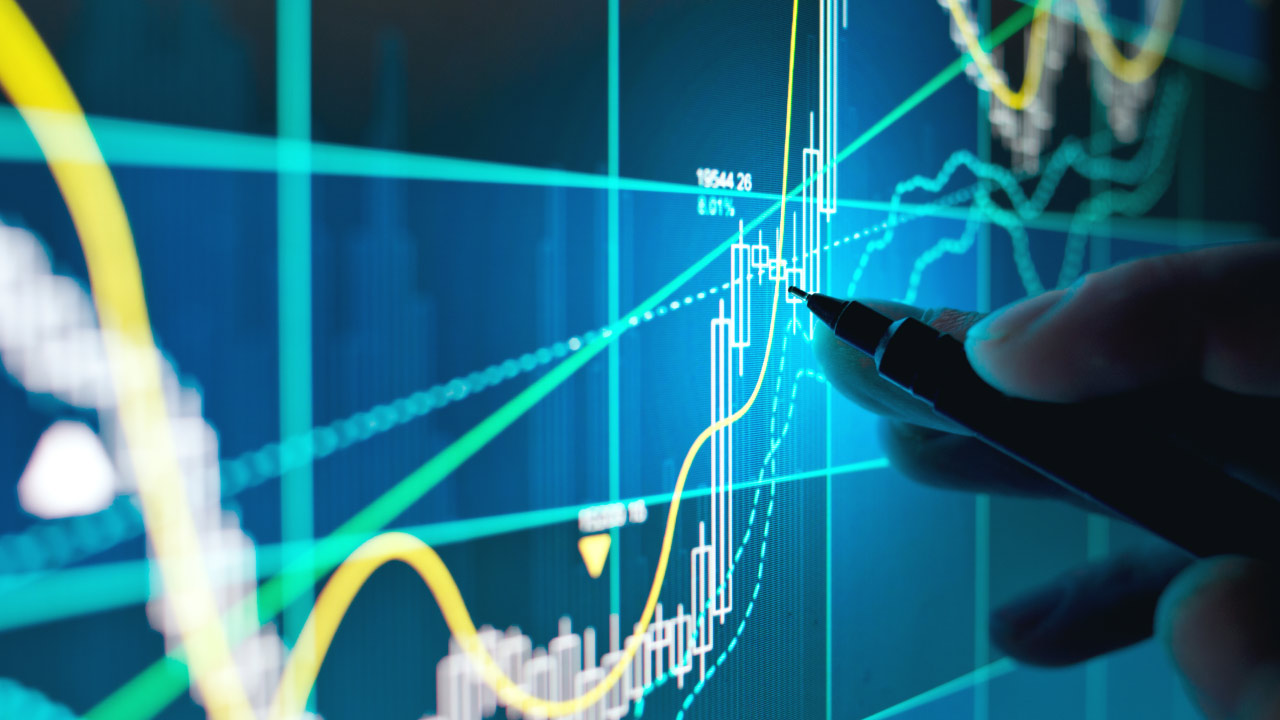
Speed Resistance Lines displayed on a financial chart with a hand holding a pen, analyzing market trends and potential support and resistance levels.
Forex 3 min read

What are Speed Resistance Lines?

05 Mar, 2024
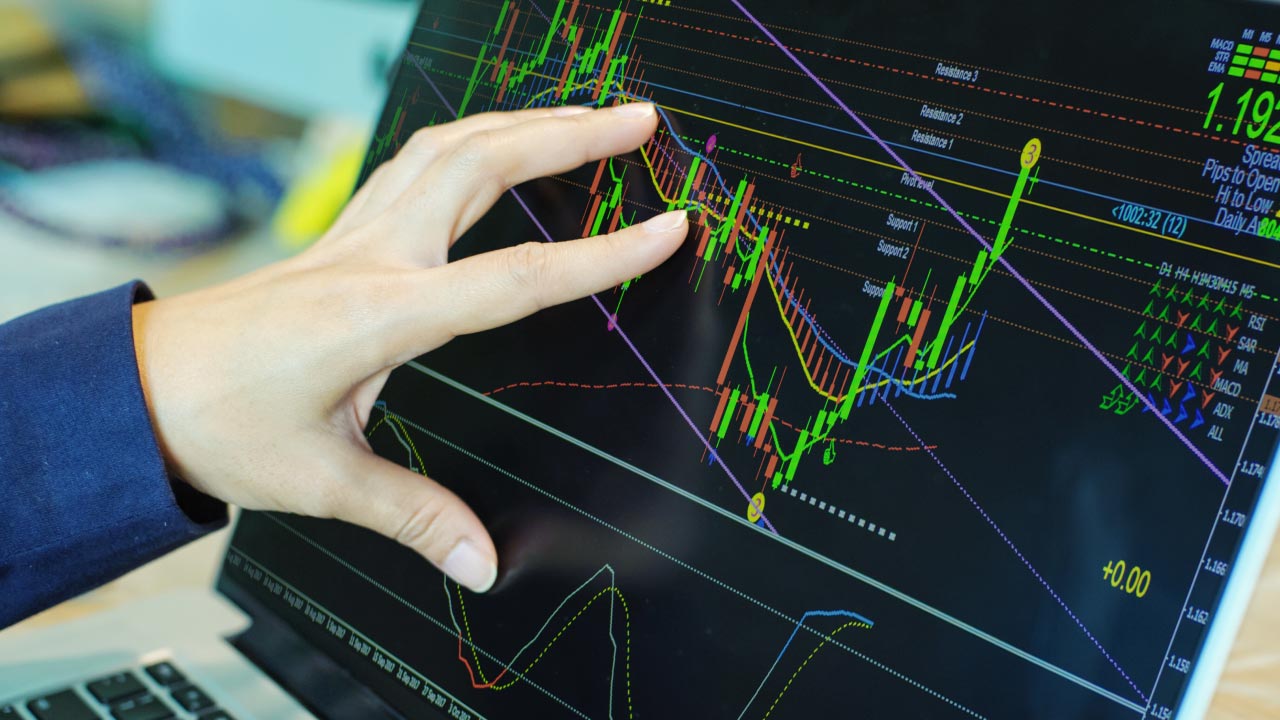
A trader analyzing a financial chart on a touchscreen laptop, displaying trend indicators, resistance and support levels, and technical analysis tools, relevant to the Aroon Indicator.
Trading Strategies 8 min read

What is The Aroon Indicator?

05 Mar, 2024
A financial chart with an upward-trending yield curve, bar graphs, and line charts illustrating market trends. Represents the concept of the yield curve and its role in financial analysis.
Forex 8 min read

Yield Curve: What it is and How to Use it

05 Mar, 2024
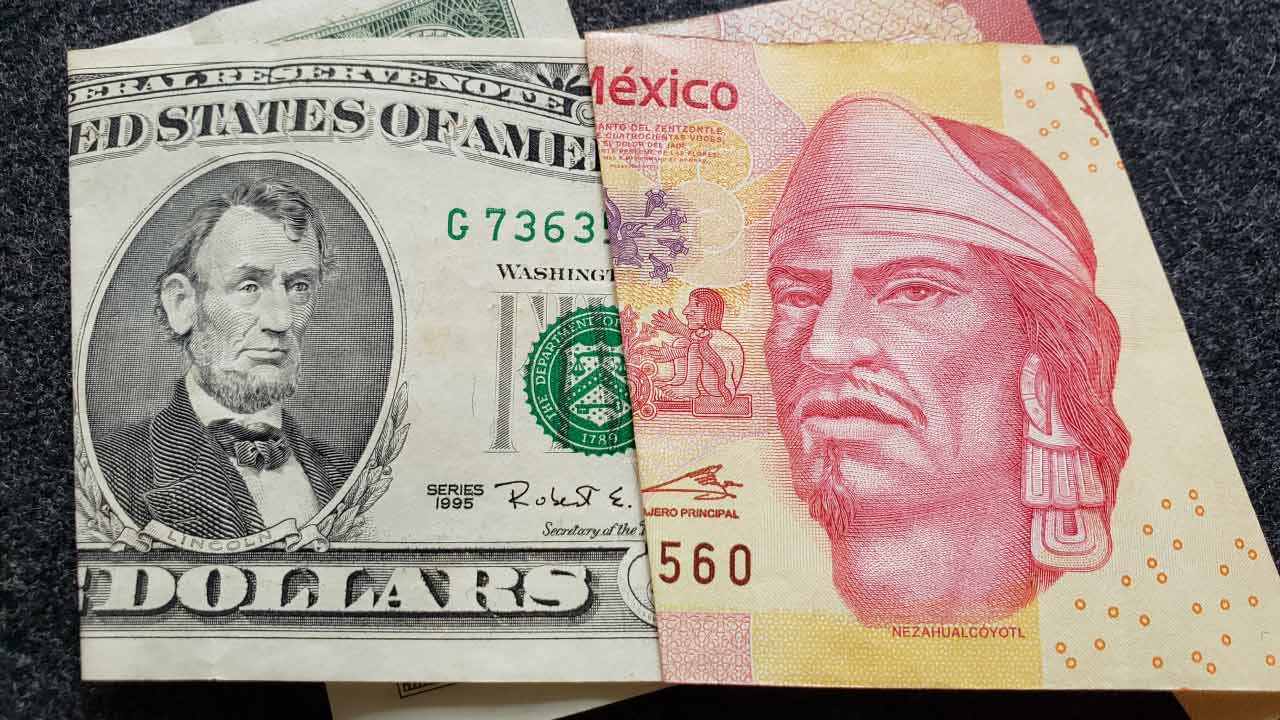
Close-up of a U.S. five-dollar bill featuring Abraham Lincoln and a 500 Mexican peso note featuring Nezahualcóyotl, symbolizing the USD/MXN currency pair in forex trading.
Forex 10 min read

How to Trade USD/MXN Currency Pair

05 Mar, 2024
How to Use The Slow Stochastic Oscillator for Day Trading
Forex 10 min read

How to Use The Slow Stochastic Oscillator for Day Trading

05 Mar, 2024
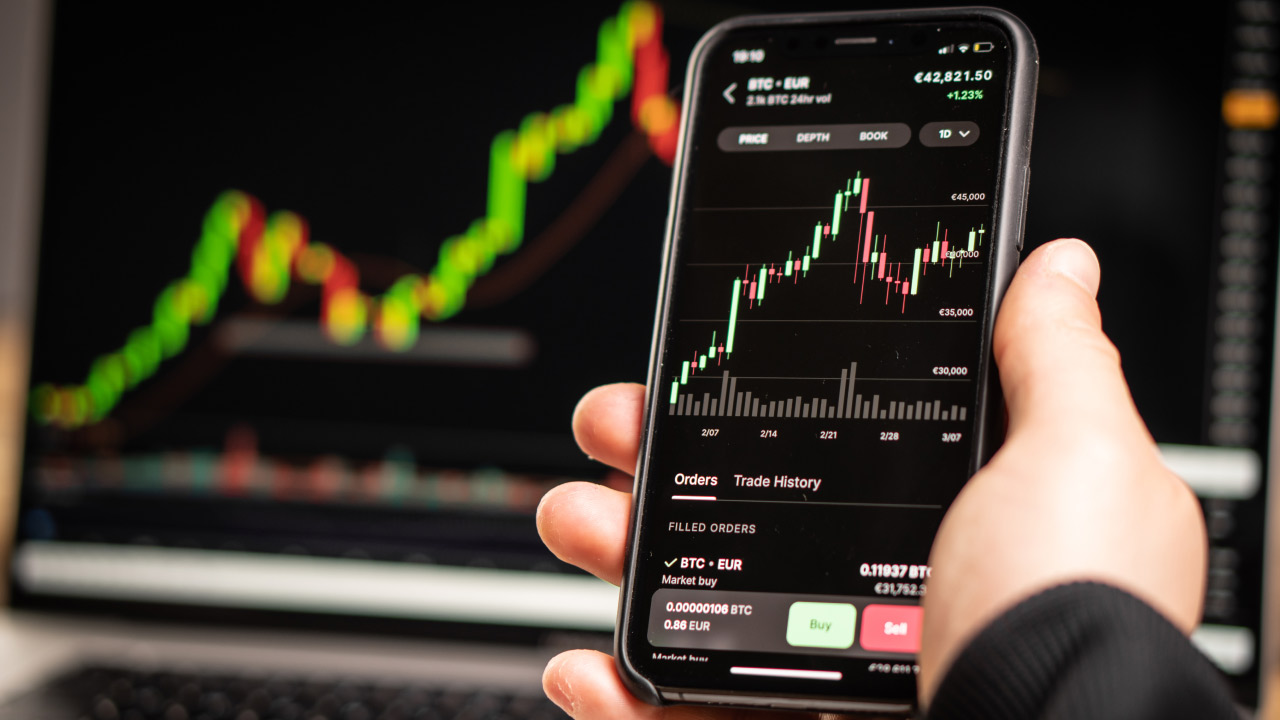
Person holding a smartphone displaying a Bitcoin to Euro (BTC/EUR) candlestick price chart with a rising trend, illustrating the concept of what price charts are and how to use them.
Forex 5 min read

What Are Price Charts (And How to Use Them?)

05 Mar, 2024
Businesswoman analyzing a stock chart on a large computer monitor using linear regression tools, with additional data displayed on a tablet and a second screen, illustrating the concept of the Linear Regression Slope.
Forex 8 min read

What is the Linear Regression Slope?

05 Mar, 2024
a stopwatch placed on a financial chart with a red flag pin marking a specific point
Trading Strategies 3 min read

How to Trade with CCI Indicator

04 Mar, 2024
Two professionals analyzing data on a laptop with an AI-powered humanoid robot, representing automated trading with MetaTrader 4.
MetaTrader 8 min read

How to Start Trading on MetaTrader 4 with Robots

04 Mar, 2024
two wooden blocks labeled "supply" and "demand" are balanced on a wooden seesaw
Economic Indicator 8 min read

How Does Supply and Demand Affect Markets?

04 Mar, 2024
abstract financial chart showing a central trend line with two parallel red lines forming a Raff Regression Channel against a blue grid background, illustrating the concept of the Raff Channel Indicator.
Trading Strategies 8 min read

What is the Raff Channel Indicator?

04 Mar, 2024
Forex Week Ahead Analysis
Week Ahead 5 min read

Forex Week Ahead Analysis: 4th March

03 Mar, 2024
featured image with images of Bitcon in silver and gold
Daily Forex Analysis 5 min read

Bitcoin Soars as New ETFs Drive Record Trades

29 Feb, 2024
Tips For Trading Gold, illustrated by a gold coin and Jonathan Kibbler raising two fingers to represent two trading tips.
Daily Forex Analysis 5 min read

Tips For Trading Gold

27 Feb, 2024
Forex Week Ahead Analysis: 26th February
Week Ahead 5 min read

Forex Week Ahead Analysis: 26th February

25 Feb, 2024

Stacks of coins with percentage symbols on top and glowing blue upward arrows, illustrating the concept of an Emerging Market.
Trading Strategies 6 min read

What is an Emerging Market?

21 Feb, 2024
man holding a tablet
Daily Forex Analysis 5 min read

AUDJPY In Focus Ahead Of RBA Meeting Minutes

19 Feb, 2024
A happy trader in a suit celebrates a big win in front of multiple monitors displaying financial charts and data.
Forex 5 min read

What to do With Big Wins as a Forex Trader?

19 Feb, 2024
Forex Week Ahead Analysis: 19th Feb
Week Ahead 8 min read

Forex Week Ahead Analysis: 19th Feb | Technical Analysis

18 Feb, 2024
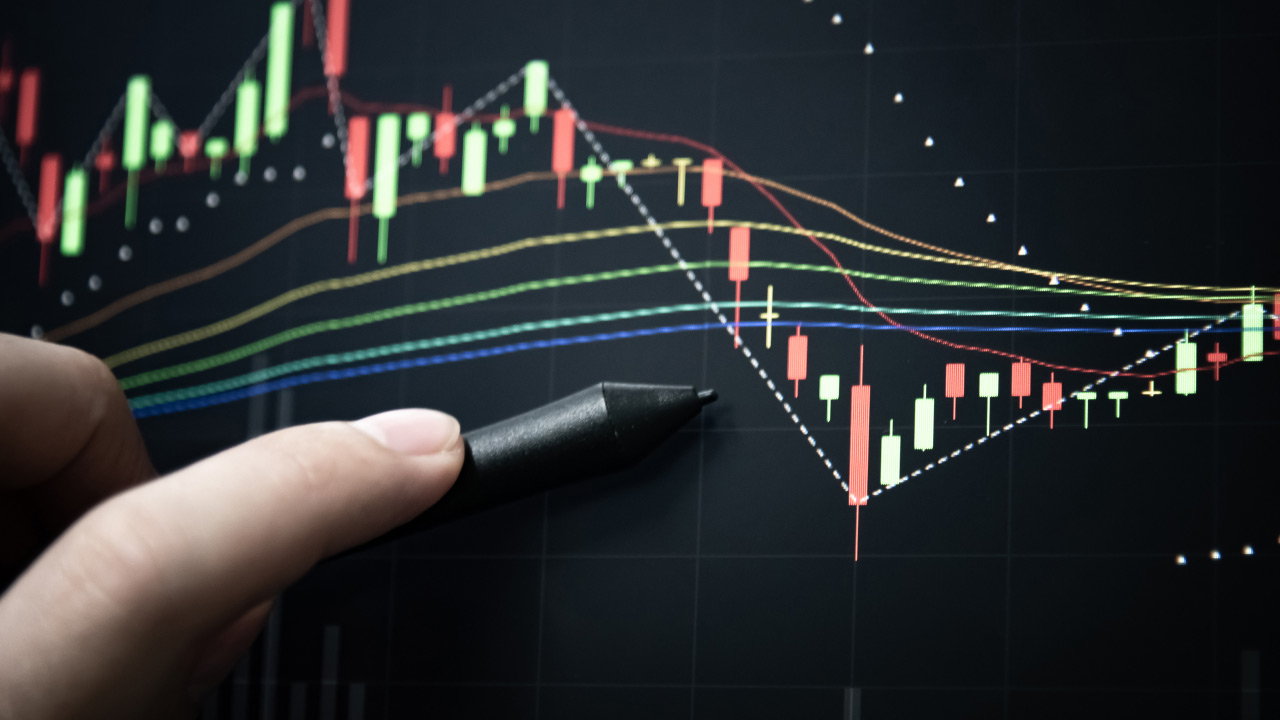
close-up image of a hand holding a stylus pointing at a candlestick chart on a digital trading screen
Trading Strategies 6 min read

5 Key Strategies for Advanced Technical Analysis

16 Feb, 2024
What is the Hidden Divergence Trading Strategy? A magnifying glass highlighting candlestick patterns and trend lines on a financial chart, representing market analysis and hidden divergence signals in trading.
Trading Strategies 10 min read

What is the Hidden Divergence Trading Strategy?

15 Feb, 2024
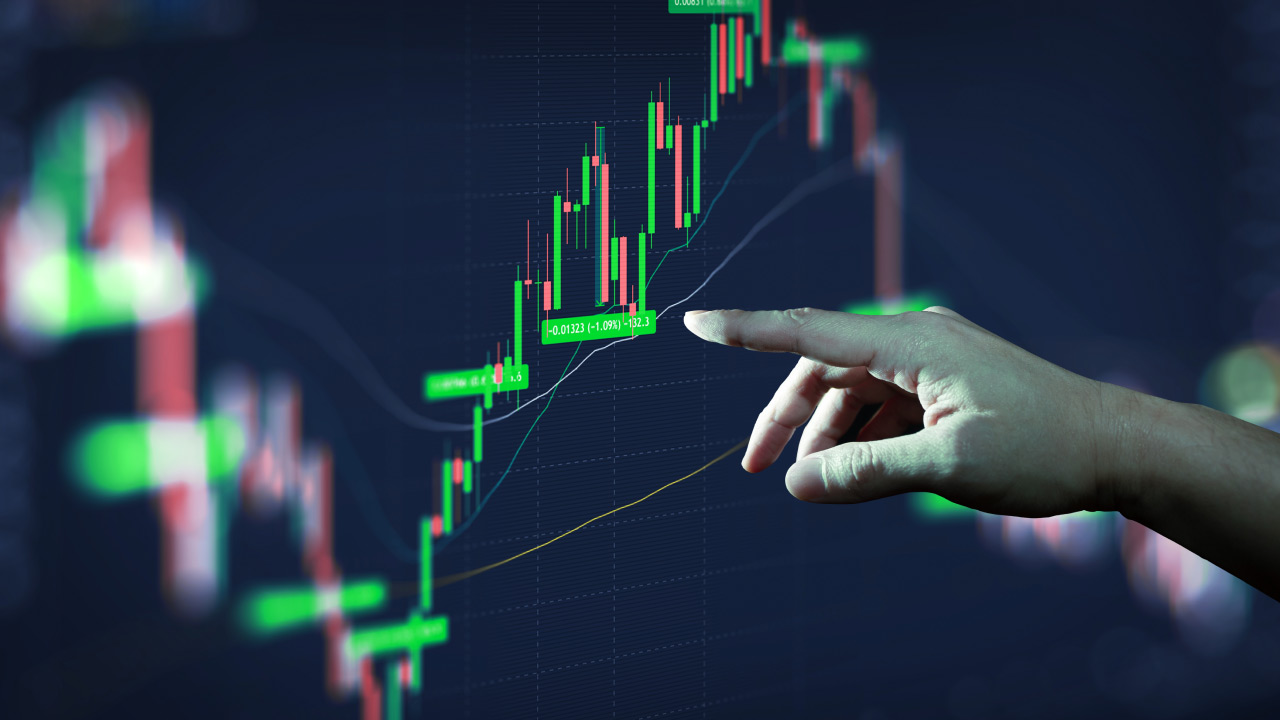
"Hand pointing at a digital forex trading chart showing green candlesticks and profit percentage labels during an upward trend.
Trading Strategies 5 min read

What is the 5-3-1 Trading Strategy in Forex?

15 Feb, 2024
Businessperson stacking coins with cash and a calculator in the background, symbolizing financial planning and setting realistic trading goals.
Trading Strategies 8 min read

How to Set Realistic Trading Goals

14 Feb, 2024
 a trader analyzing candlestick chart patterns on a computer monitor while holding a smartphone and a pen
Trading Strategies 5 min read

How to Learn From Your Trading Mistakes With Technical Analysis

14 Feb, 2024
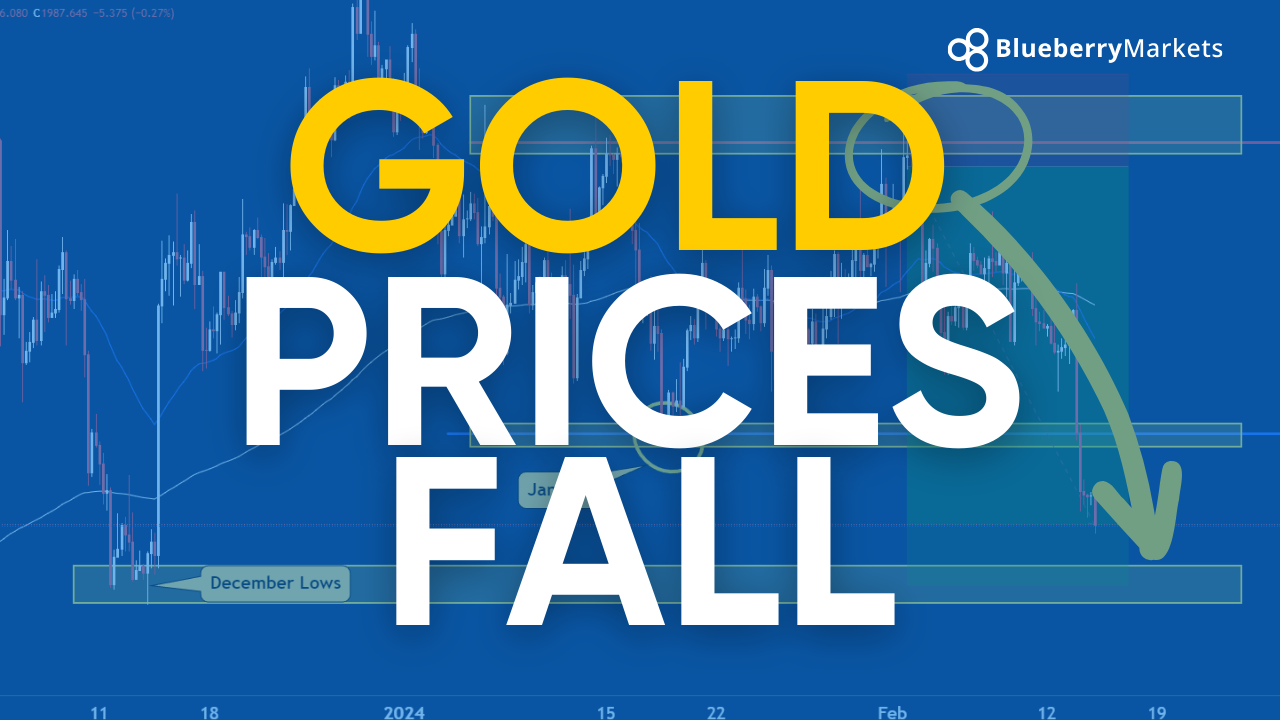
Bold text stating "GOLD PRICES FALL" overlaid on a candlestick chart, with a large downward green arrow, illustrating the question: will gold prices fall further?
Daily Forex Analysis 5 min read

Will Gold Prices Fall Further?

14 Feb, 2024
A magnifying glass focusing on a red upward trend line, illustrating five trading strategies for a highly volatile market
Trading Strategies 8 min read

Five Trading Strategies For a Highly Volatile Market

13 Feb, 2024
trading screen showing different currency pairs
4 min read

How to Build Flexibility in Forex Trading

13 Feb, 2024
a person holding a smartphone displaying stock market data
MetaTrader 7 min read

How to Check Your Trade History in MT5?

13 Feb, 2024
A man seated in an office chair raising his arms in celebration, illustrating the concept of what it takes to cultivate a winning attitude for forex trading.
Forex 5 min read

What Does it Take to Cultivate a Winning Attitude for Forex Trading

13 Feb, 2024
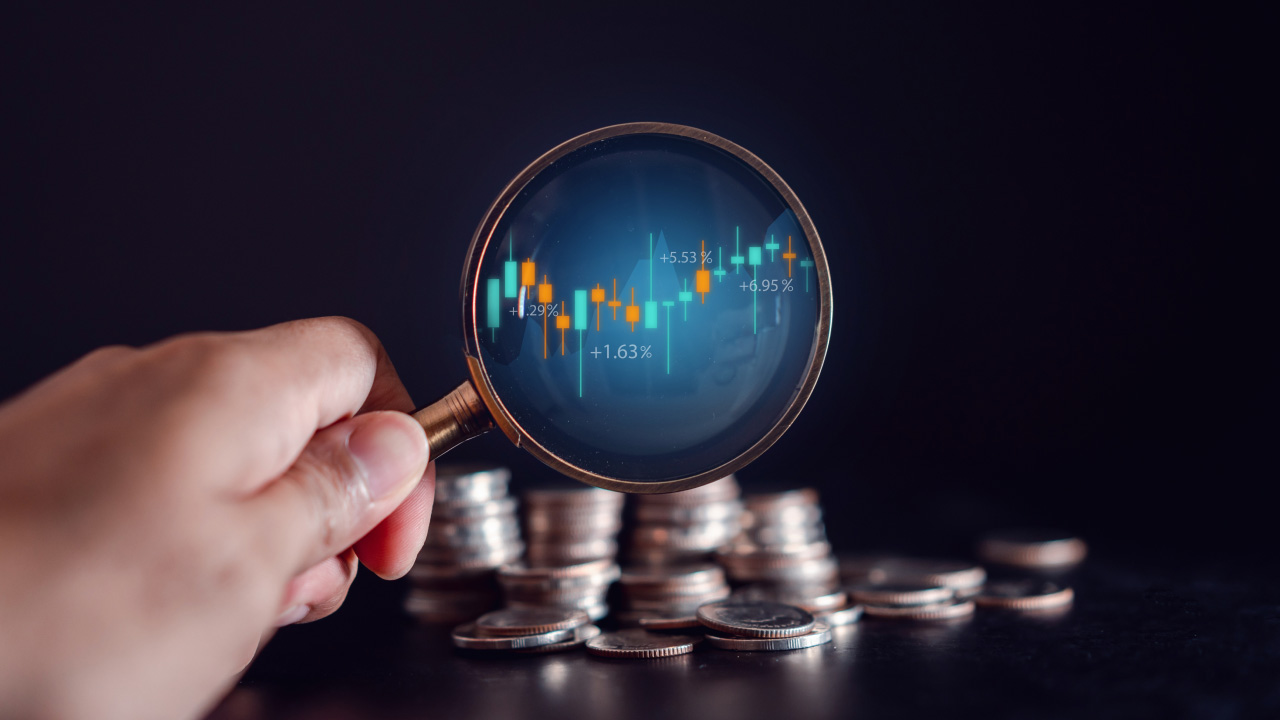
Hand holding a magnifying glass focused on a candlestick chart with percentage gains, placed over stacked coins, illustrating why forex traders should use a risk calculator.
Forex 7 min read

Why Forex Traders Should Use a Risk Calculator

13 Feb, 2024
a hand interacting with a digital display of financial data, including candlestick charts
Trading Strategies 5 min read

How to Combine Trading Strategies

12 Feb, 2024
How and When to Buy or Sell in Forex Trading – A close-up of metallic dice labeled 'BUY' and 'SELL' placed among coins, with a blurred candlestick chart in the background, symbolizing key forex trading decisions.
Forex 5 min read

How and When to Buy or Sell in Forex Trading

12 Feb, 2024
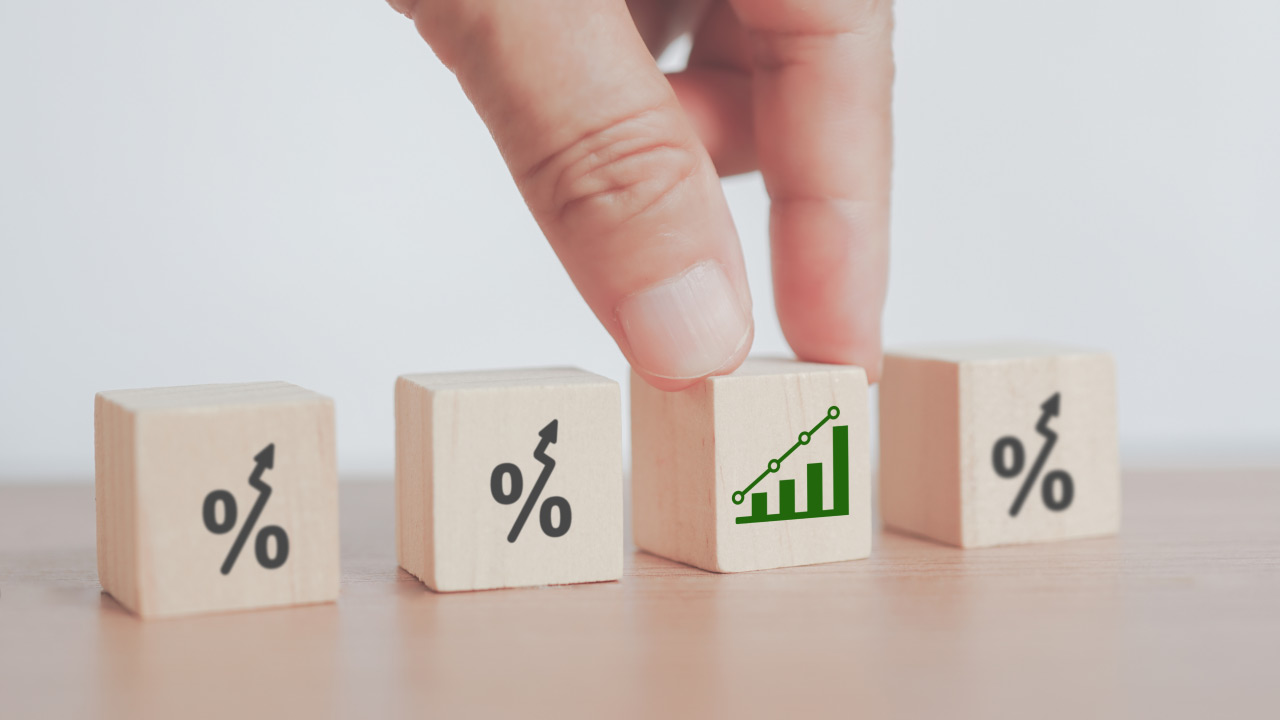
A hand picks up a wooden block displaying a green upward-trending bar chart, positioned between three other blocks that show percentage signs with upward arrows.
Forex 8 min read

How to Trade Low Volatility Markets?

12 Feb, 2024
A digital euro and dollar symbol, illustrating Forex Week Ahead Analysis: 12th Feb | EURUSD | GBPUSD | SILVER.
Week Ahead 8 min read

Forex Week Ahead Analysis: 12th Feb | EURUSD | GBPUSD | SILVER

11 Feb, 2024
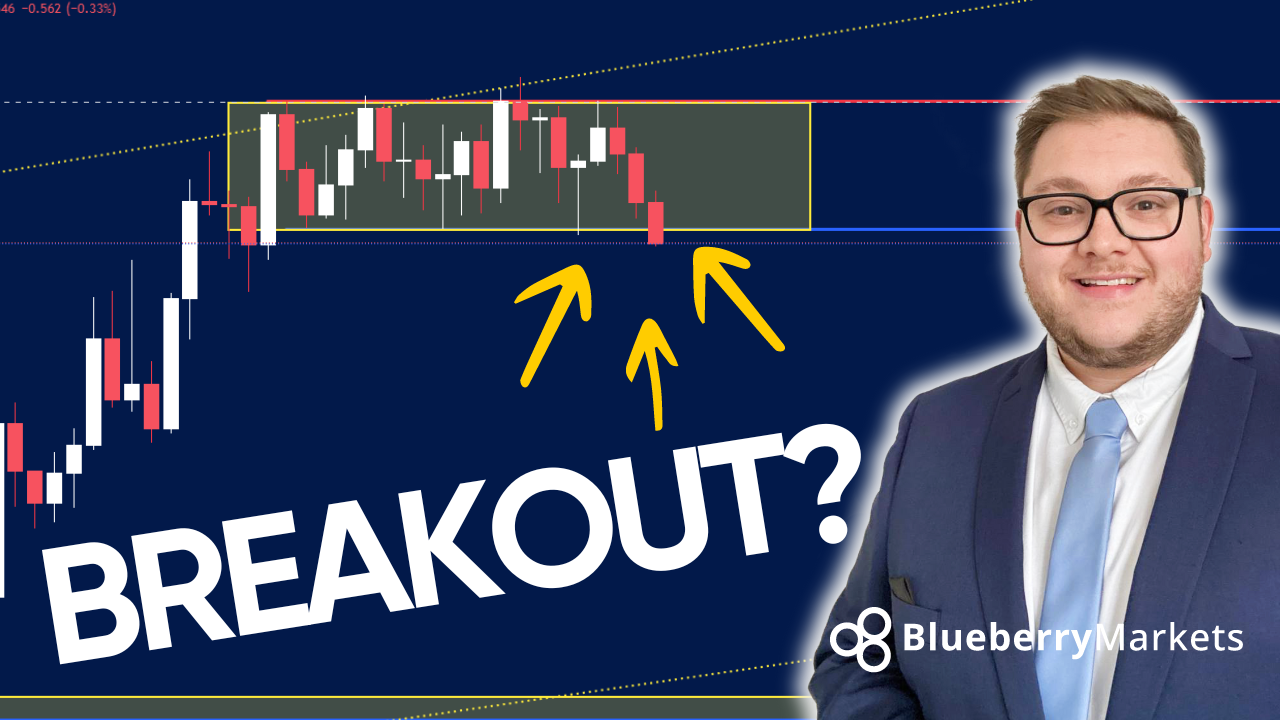
A man in a suit and tie stands beside a candlestick chart showing a breakout below a consolidation zone, highlighted by a yellow box and yellow arrows pointing down.
Daily Forex Analysis 3 min read

Have Traders Spotted This Forex Breakout?

07 Feb, 2024
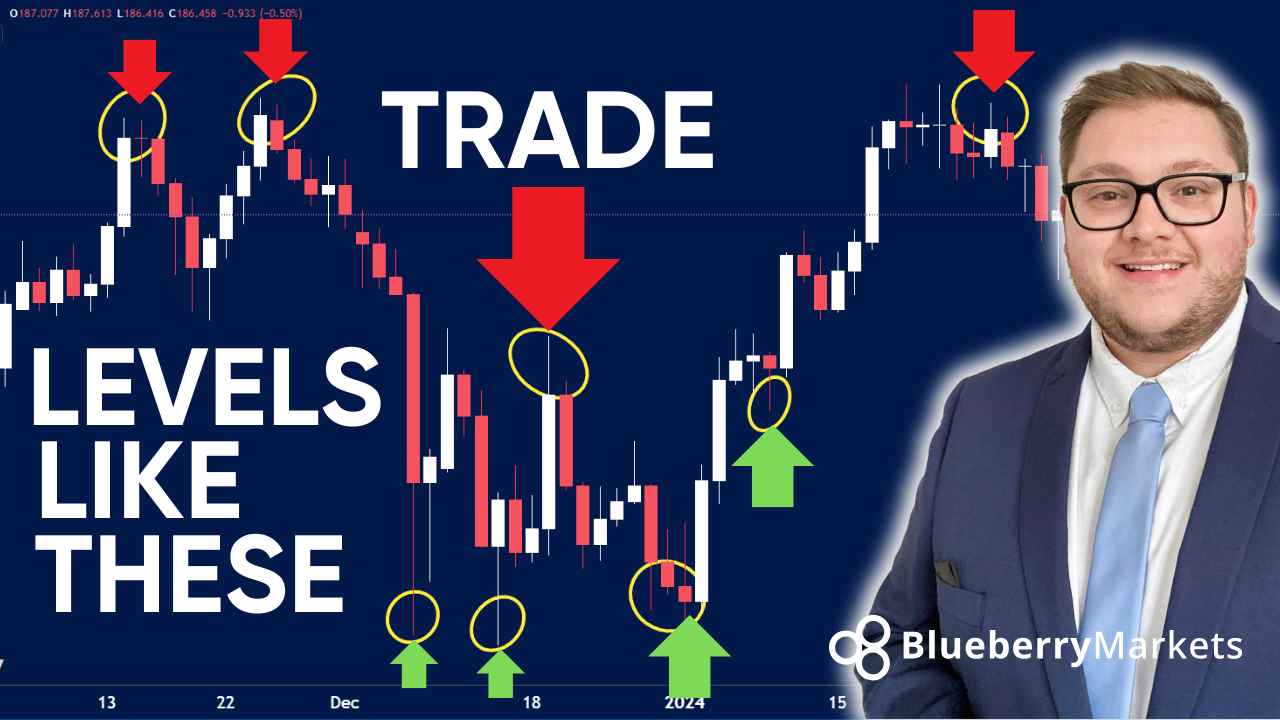
featured image from Blueberry Markets featuring a candlestick chart with key trading levels
Daily Forex Analysis 7 min read

A Blueprint to Consistency in Forex Trading

05 Feb, 2024
Forex Week Ahead Analysis: 5th February
Week Ahead 5 min read

Forex Week Ahead Analysis: 5th February | Technical Analysis

04 Feb, 2024
USD Index Key Levels, illustrated by an image of Jonathan Kibbler with the United States logo in the background and text focusing on the USD index.
Daily Forex Analysis 3 min read

USD Index Key Levels

31 Jan, 2024
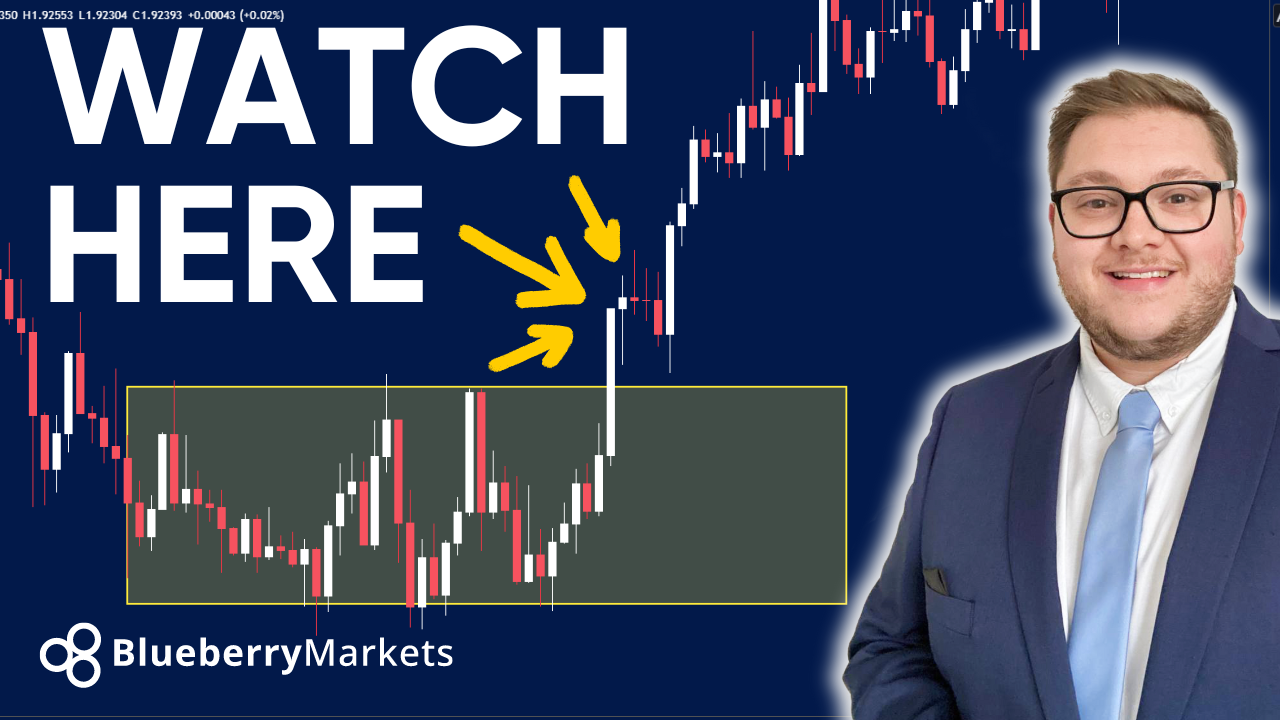
Background of a man with glasses, illustrating "Don't Trade GBP/AUD Until You See This" for a YouTube photo
Daily Forex Analysis 3 min read

Don't Trade GBP/AUD Until You See This

29 Jan, 2024
a miniature businessman figurine standing on a U.S. hundred-dollar bill
Week Ahead 8 min read

Forex Week Ahead Analysis: 27th January

28 Jan, 2024
Forex Week Ahead Analysis: 29th Jan
Week Ahead 8 min read

Forex Week Ahead Analysis: 29th Jan | Technical Analysis

28 Jan, 2024
A magnifying glass highlighting a candlestick chart with red and green bars on a dark blue background, representing technical analysis and the three-bar reversal pattern in day trading.
Forex 8 min read

Three-Bar Reversal Pattern For Day Trading

26 Jan, 2024
What is the Retail Sales Index? A globe surrounded by cardboard boxes on a keyboard, symbolizing global e-commerce and retail trade performance.
Trading Strategies 5 min read

What is the Retail Sales Index?

26 Jan, 2024
wooden blocks spelling "FED" placed on 100 US dollar bills
Forex 6 min read

A Forex Trader's Guide to Federal Reserve Bank

26 Jan, 2024

Close-up image of two currency banknotes: a €50 Euro note partially overlaying a ¥1000 Japanese Yen note.
Forex 8 min read

How to Trade the EUR/JPY Currency Pair?

26 Jan, 2024
digital chess pieces on a black lighted background with financial candlestick chart
Trading Strategies 8 min read

How Trading Competitions Work?

26 Jan, 2024
The Year Ahead: Top Crypto Predictions for 2024, illustrated by gold cryptocurrency coins.
Cryptocurrencies 8 min read

The Year Ahead: Top Crypto Predictions for 2024

26 Jan, 2024
Image of two metallic dice placed on a financial chart, illustrating the concept of what competitive spreads are.
Forex 6 min read

What Are Competitive Spreads?

26 Jan, 2024
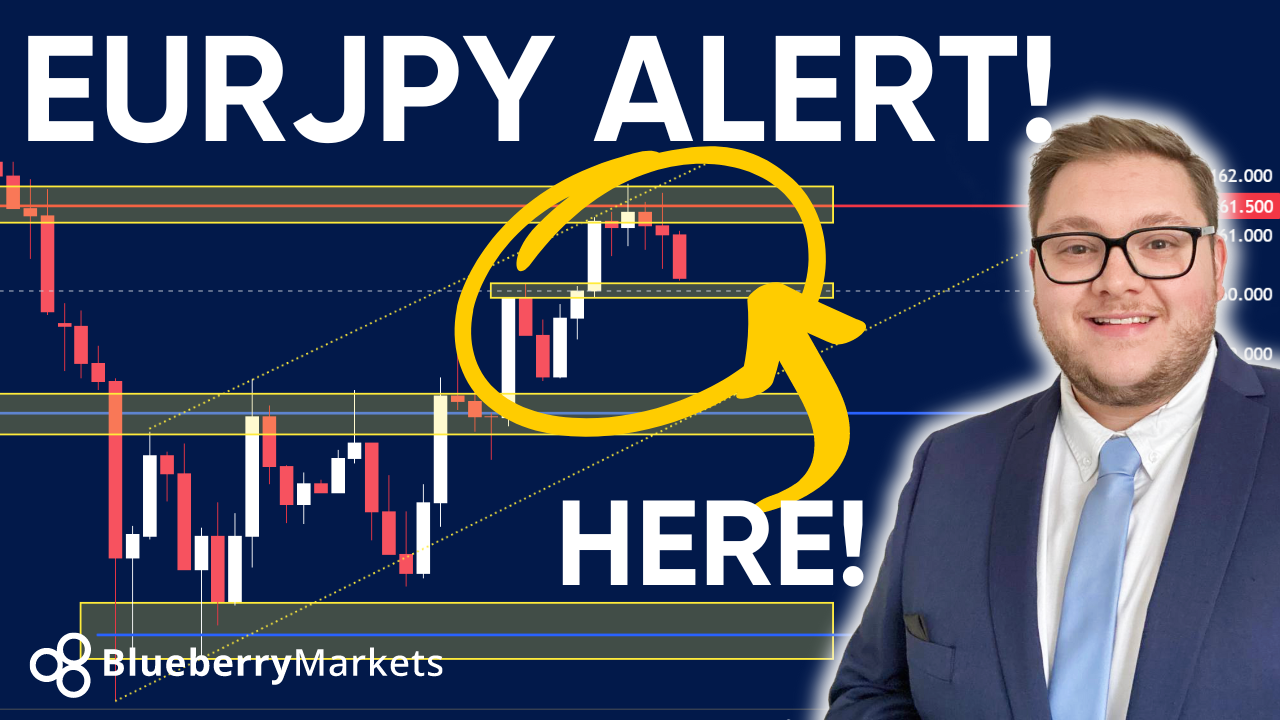
EURJPY alert image with price action trading indicators, illustrating "EURJPY What Next?"
Daily Forex Analysis 3 min read

EURJPY What Next? | Price Action Trading

24 Jan, 2024
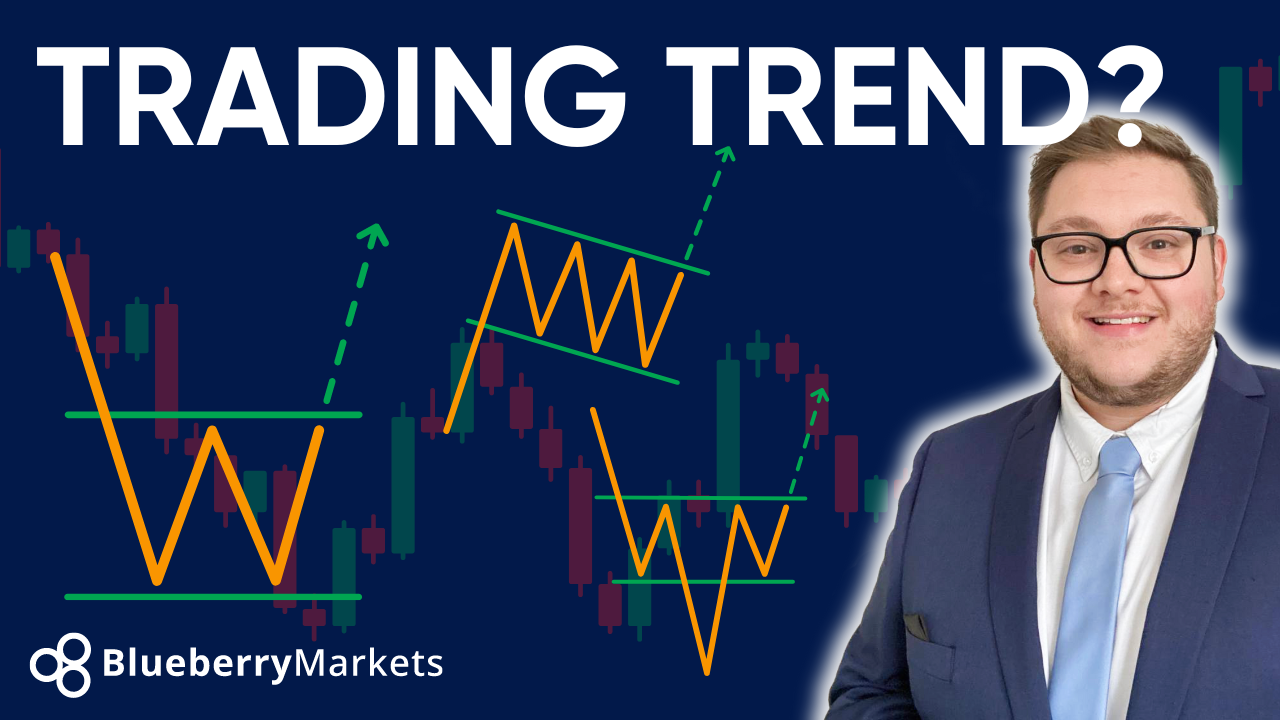
trading trend photo caption with a Jonathan Kibbler
Daily Forex Analysis 5 min read

Is This The NEXT Trending Forex Pair?

22 Jan, 2024
Forex Week Ahead Analysis: 22nd Jan
Week Ahead 8 min read

Forex Week Ahead Analysis: 22nd Jan | Technical Analysis

21 Jan, 2024
a trading platform displayed on a laptop screen, featuring colorful candlestick charts and technical indicators
MetaTrader 6 min read

How to Download Historical Data on MT4

17 Jan, 2024
A magnifying glass placed over a chart with a yellow arrow, illustrating the concept of the Consumer Sentiment Index.
Economic Indicator 6 min read

What is the Consumer Sentiment Index?

17 Jan, 2024
A man in a suit stands beside a bold headline "WILL THIS MARKET CRASH?" with a red downward arrow over a blurred candlestick chart, illustrating market concerns.
Daily Forex Analysis 5 min read

Will This Market Crash?

17 Jan, 2024
JPY Forecast for 2024 – A golden yen currency symbol placed on a Japanese flag, symbolizing the outlook for the Japanese yen in the forex market.
Economic Indicator

JPY Forecast For 2024

15 Jan, 2024
Understanding the Link Between Trade and Capital Flows, illustrated by a hand placing a stack of gold coins on a circular network diagram.
Economic Indicator 5 min read

Understanding the Link Between Trade and Capital Flows

15 Jan, 2024
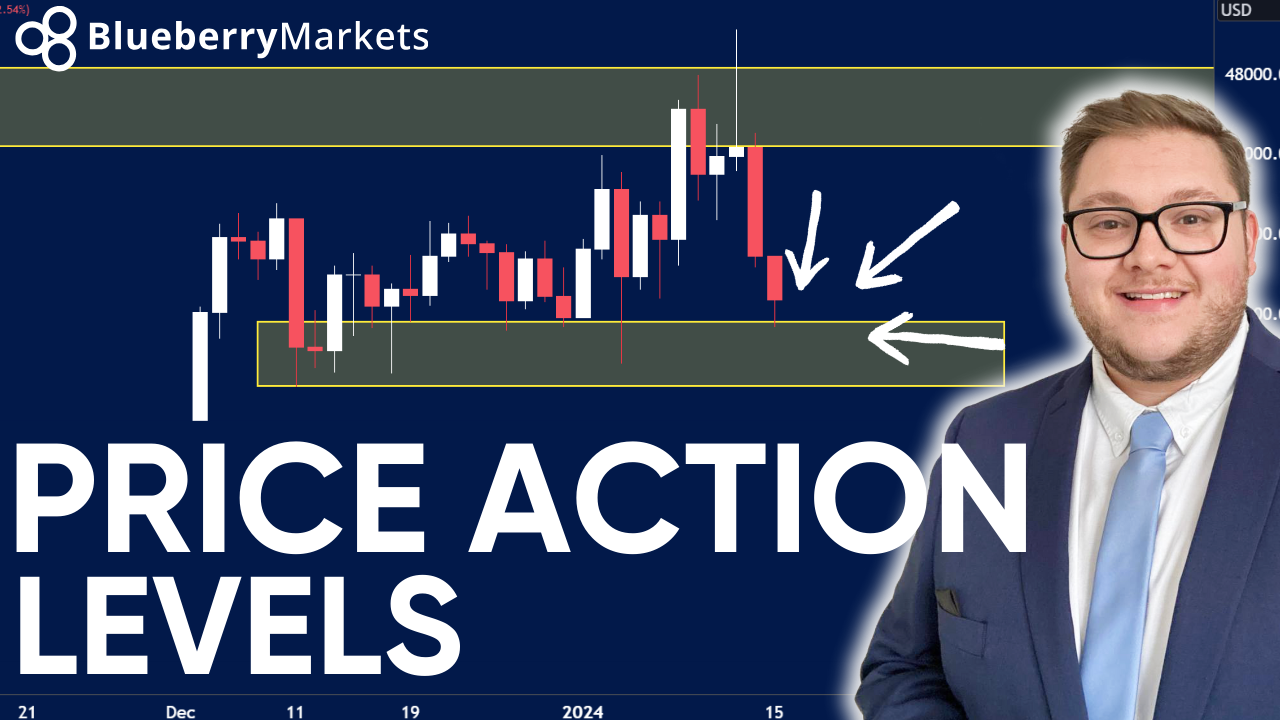
A candlestick chart showing Bitcoin price action levels with support and resistance zones highlighted, illustrating the question: where is the Bitcoin price heading now?
Daily Forex Analysis 3 min read

Where Is The Bitcoin Price Heading Now?

15 Jan, 2024
A banner with yen and dollar signs and text referencing the title, illustrating Forex Week Ahead Analysis: 15th Jan | Technical Analysis.
Week Ahead 5 min read

Forex Week Ahead Analysis: 15th Jan | Technical Analysis

14 Jan, 2024
Price Action Trading In Forex, illustrated by Jonathan Kibbler with a chart background and the text "GBP" and "JPY" below.
Daily Forex Analysis 5 min read

Price Action Trading In Forex

10 Jan, 2024
A close-up view of a candlestick chart showing price movements and triangle chart patterns, used in technical analysis for trading decisions.
Forex 8 min read

Top Triangle Chart Patterns

09 Jan, 2024
stack of gold bars
Commodities 8 min read

Gold Price Forecast For 2024

09 Jan, 2024
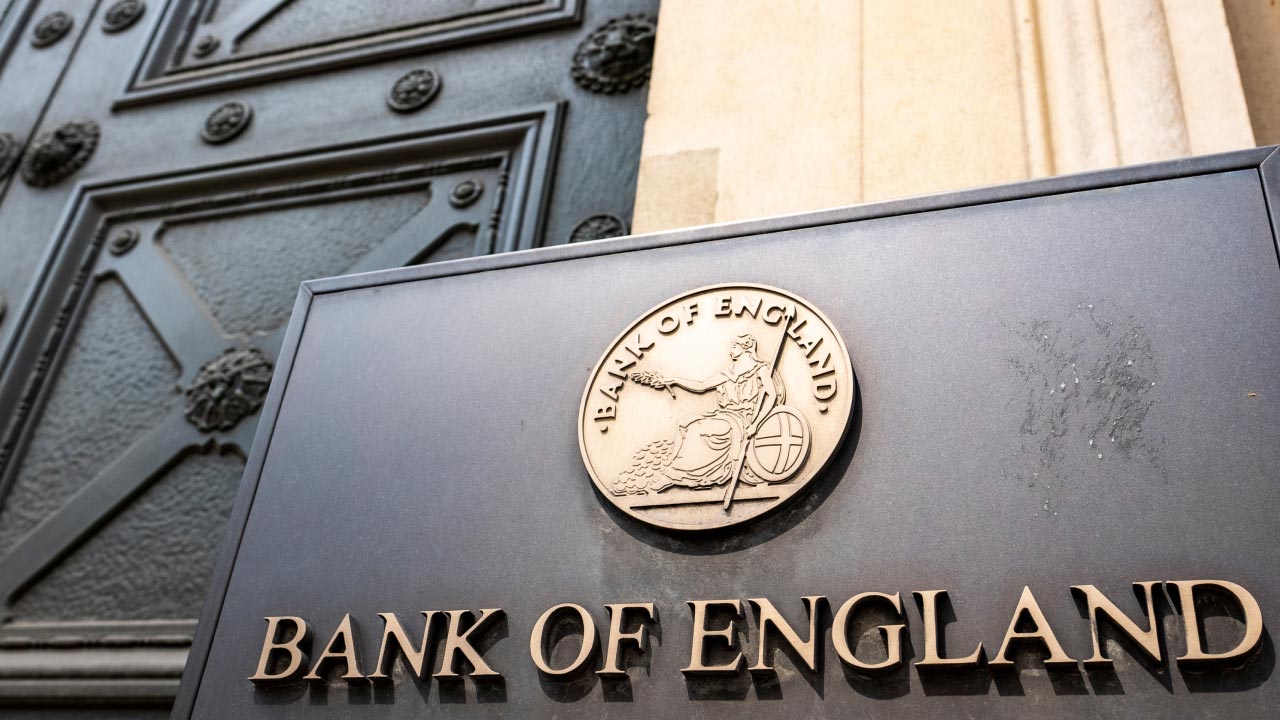
Bank of England's building facade
Economic Indicator 5 min read

How Does The Bank of England Impact The Forex Market?

09 Jan, 2024

Stacks of gold coins arranged in ascending order on top of dollar bills, illustrating the concept of Leverage in Forex.
Forex 10 min read

What is Leverage in Forex?

09 Jan, 2024
A trader analyzing forex charts on a smartphone and laptop, with 'UP or DOWN?' displayed on the screen, symbolizing the challenge of predicting market movements.
Forex 2 min read

How To Predict Forex Movements?

08 Jan, 2024
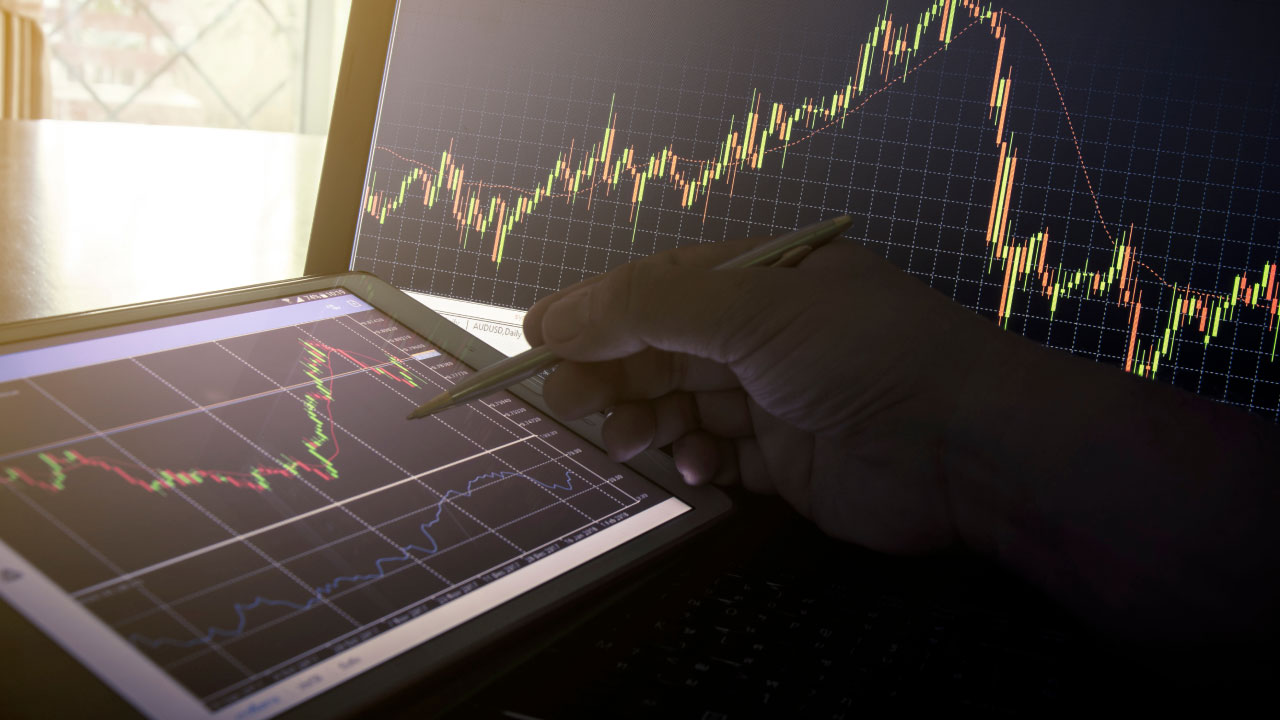
What is the Tick Volume Indicator? A trader analyzing candlestick charts on a tablet and laptop, highlighting market price movements and volume activity.
Forex 5 min read

What is The Tick Volume Indicator?

08 Jan, 2024
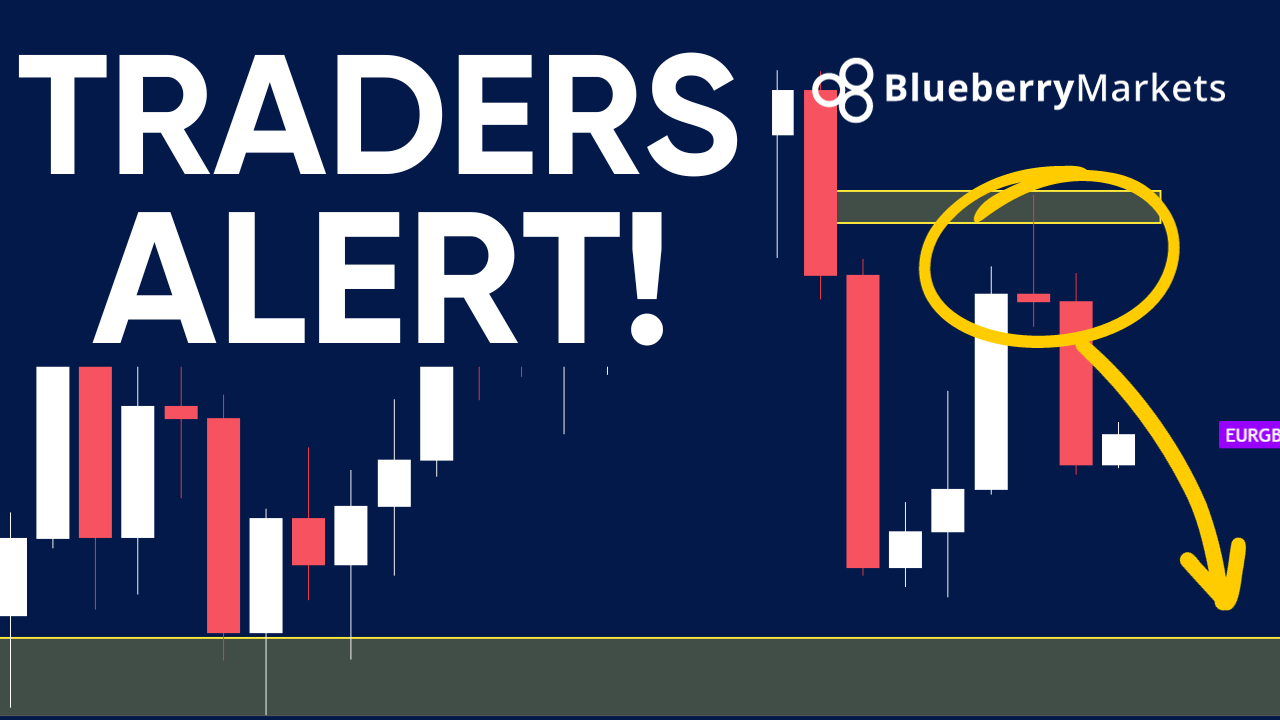
A trader analyzing the EURGBP technical analysis on a screen, illustrating forex traders alert! EURGBP technical analysis
Daily Forex Analysis 5 min read

Forex Traders Alert! EURGBP Technical Analysis

08 Jan, 2024
Forex 7 min read

How Setting The Right Position Sizing Can Save Traders?

08 Jan, 2024
Trading Biases vs Predictions: What's The Difference?, illustrated by a glowing green upward arrow standing out among many red downward arrows, symbolizing the difference between trading biases and market predictions.
Trading Strategies 8 min read

Trading Biases vs Predictions: What's The Difference?

08 Jan, 2024
Forex Week Ahead Analysis: 8th Jan
Week Ahead 5 min read

Forex Week Ahead Analysis: 8th Jan | Technical Analysis

07 Jan, 2024
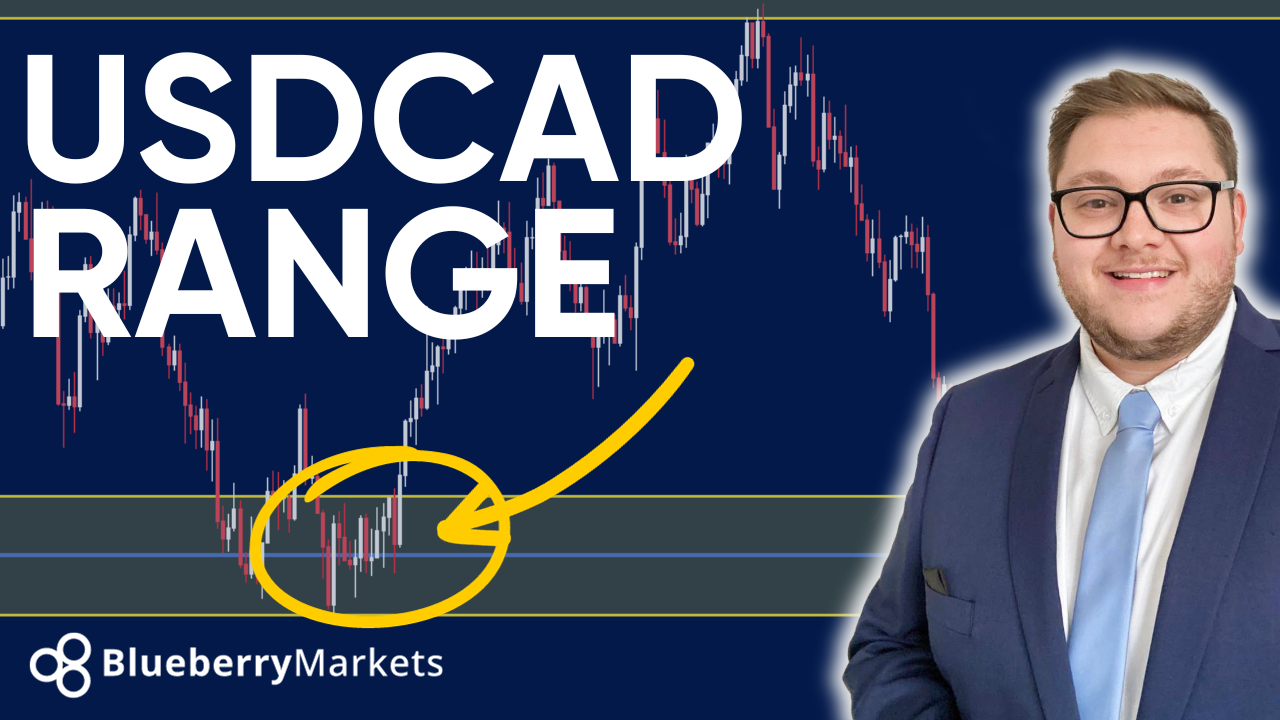
Master Trading The Range In Forex | In The Trading Zone — with USD/CAD range text, featuring Jonathan Kibbler and graph and chart visuals in the background.
Daily Forex Analysis 5 min read

Master Trading The Range In Forex | In The Trading Zone

03 Jan, 2024
Wooden blocks displaying the numbers "2024," illustrating the forex economic calendar 2024 and what to watch
Economic Indicator 5 min read

Forex Economic Calendar 2024: What to Watch

02 Jan, 2024
Popular Stocks to Start Your 2024 Out Strong, illustrated by a monitor showing stock exchange data.
Shares 10 min read

Popular Stocks to Start Your 2024 Out Strong

02 Jan, 2024
Forex Week Ahead Analysis: 2nd Jan
Week Ahead 5 min read

Forex Week Ahead Analysis: 2nd Jan | Technical Analysis

01 Jan, 2024
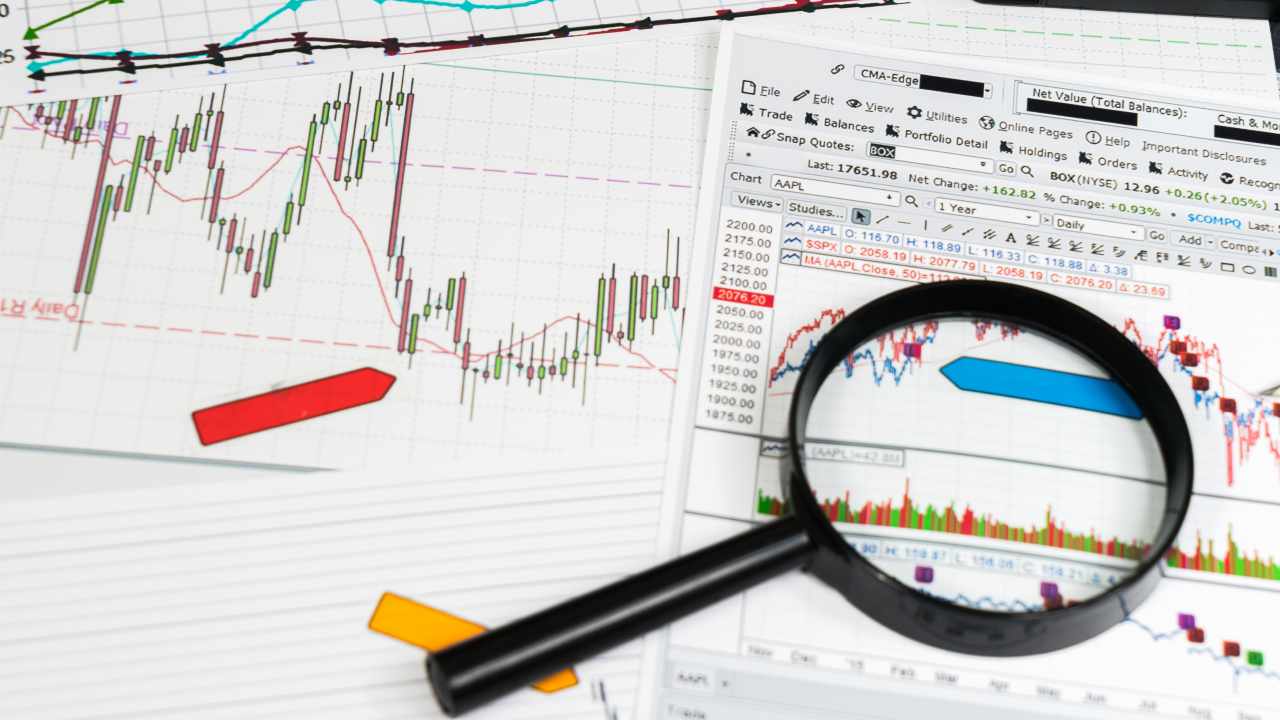
A magnifying glass placed over trading charts, symbolizing the concept of stop-loss hunting and strategies to avoid market manipulation.
Trading Strategies 8 min read

How to Avoid Stop-Loss Hunting?

27 Dec, 2023
A focused man wearing glasses and a light blue shirt is analyzing financial charts on two monitors at a modern office desk
Forex 8 min read

Helpful Tips For Forex Trading Newbies

27 Dec, 2023
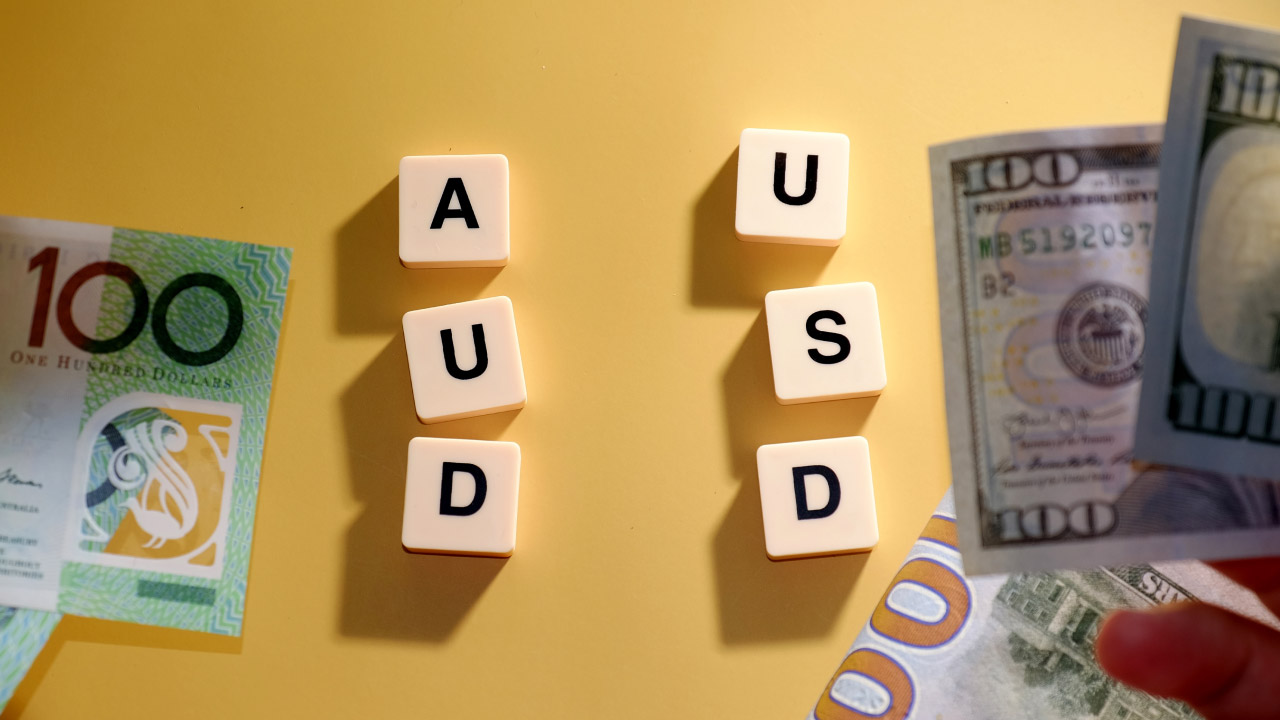
A visual representation of the AUD/USD currency pair. On a yellow background, the letters "AUD" and "USD" are arranged vertically using white letter tiles.
Forex 8 min read

How to Trade AUD/USD?

27 Dec, 2023
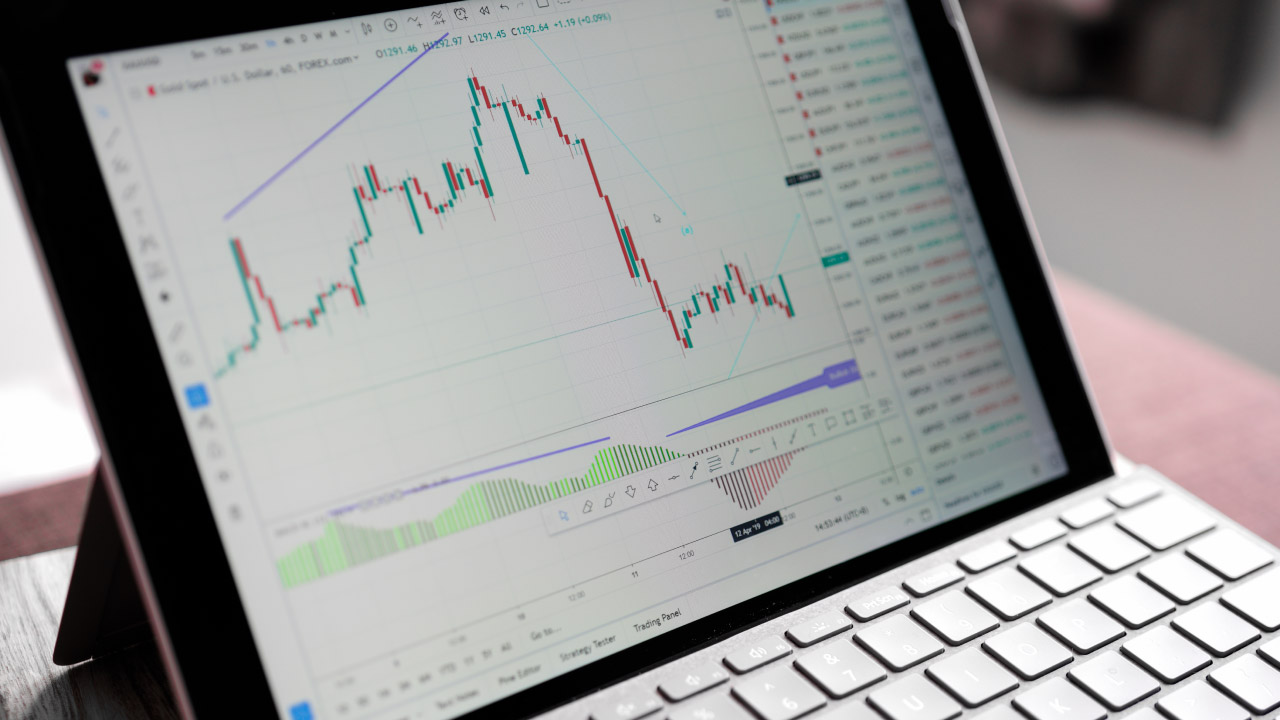
A close-up image of a tablet on a keyboard stand displaying a forex trading chart with candlestick patterns
Forex 8 min read

How to Use a Forex Demo Account for Practice?

27 Dec, 2023
A trader monitoring forex charts on a smartphone and desktop screen, analyzing currency fluctuations to manage portfolio exposure effectively.
Trading Strategies 5 min read

How to Manage Currency Exposure in Your Portfolio?

26 Dec, 2023
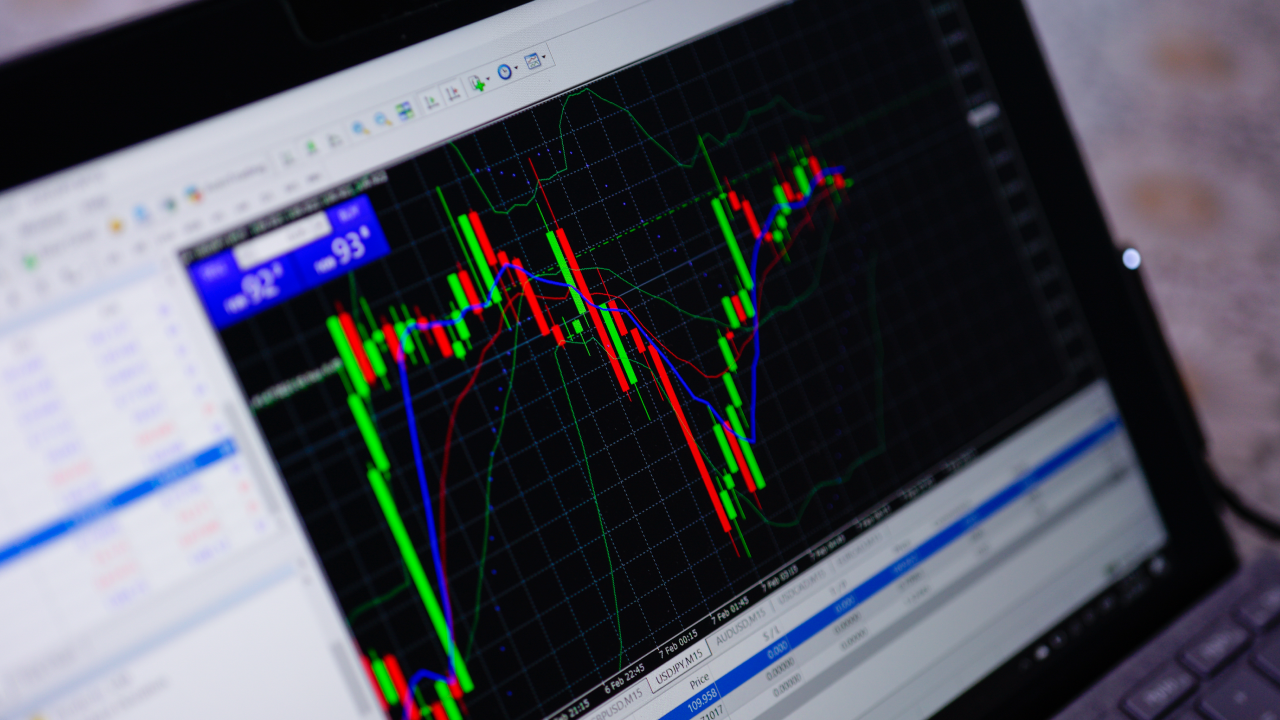
Trading with MetaTrader's Forex Volume Indicator displayed on a computer screen, showing chart analysis tools and market data.
MetaTrader 8 min read

Trading with MetaTrader's Forex Volume Indicator

26 Dec, 2023
Red financial chart with a downward trend and a large red arrow indicating a drawdown in forex trading.
Trading Strategies 5 min read

What is Drawdown in Forex Trading?

26 Dec, 2023
Two individuals in business attire analyzing a candlestick chart on a laptop screen, illustrating forex predictions 2024 and trends shaping the future of forex markets
Forex 8 min read

Forex Predictions 2024: Trends Shaping the Future of Forex Markets

26 Dec, 2023
A crystal globe on a stand placed in front of a blurred digital screen displaying market data
Forex 8 min read

How to Trade the Impact of Politics on Forex Markets?

26 Dec, 2023
A smartphone screen displaying the Bank of Japan logo held in front of a blurred Japanese flag, illustrating why the BoJ intervenes in the forex markets.
Forex 5 min read

Why Does the BoJ Intervene in the Forex Markets?

26 Dec, 2023
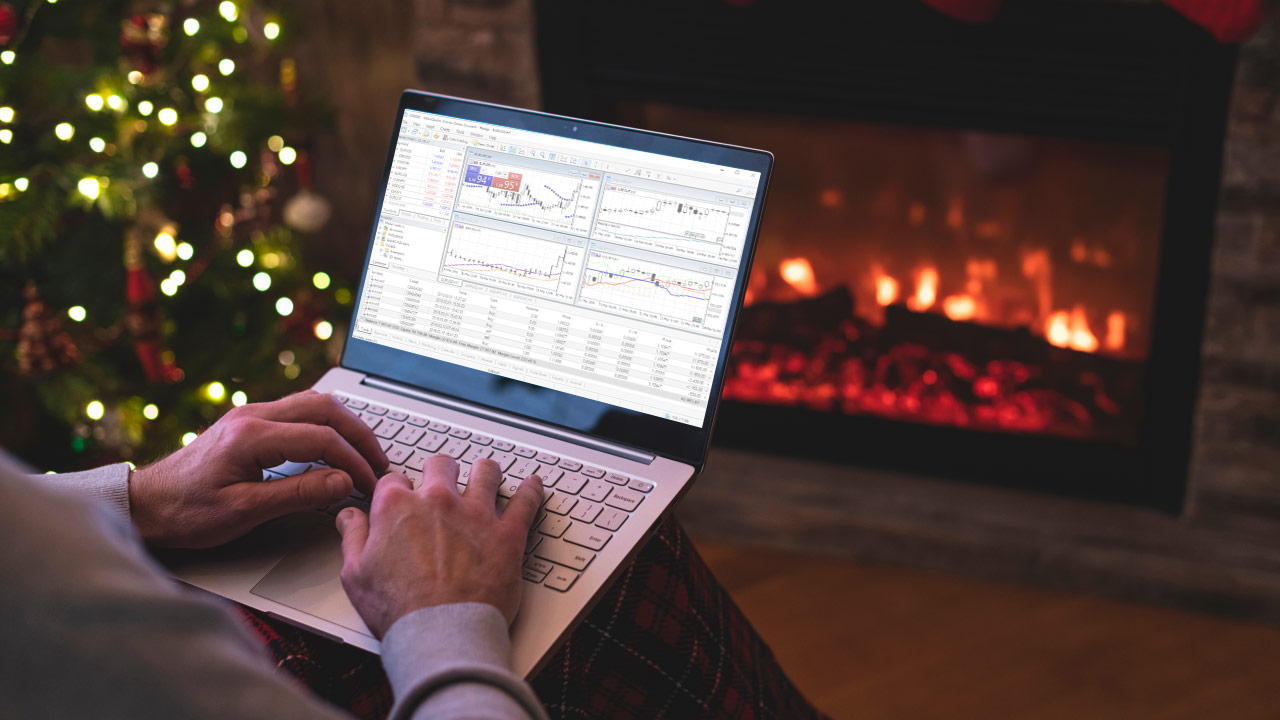
Top Tips to Resume Trading After The 2023 Christmas Break, illustrated by a person trading forex on a laptop by a fireplace during Christmas, with trading charts displayed on the screen.
Trading Strategies 5 min read

Top Tips to Resume Trading After The 2023 Christmas Break

20 Dec, 2023
Top Trading Strategies For GBP/USD, illustrated by the GBPUSD currency pair displayed on a digital trading screen with a green exchange rate.
Trading Strategies 8 min read

Top Trading Strategies For GBP/USD

20 Dec, 2023
Silhouette of large "2024" numbers set against a sunset, illustrating the concept of what higher oil prices in 2024 could mean for the markets.
Economic Indicator 5 min read

What Higher Oil Prices in 2024 Could Mean For The Markets?

20 Dec, 2023
Financial chart displaying a golden cross pattern with moving averages crossing, indicating a potential bullish trend in trading.
Trading Strategies 8 min read

What is Golden Cross Trading?

18 Dec, 2023
 A Blueberry Markets promotional image with the text "Find Better Levels" over a candlestick trading chart.
Daily Forex Analysis 4 min read

How To Find Better Forex Trading Levels

18 Dec, 2023
A bold, golden 2024 text overlaid on a financial chart with candlestick patterns, symbolizing economy and stock market predictions for the year.
Economic Indicator 5 min read

2024 Economy And Stock Market Predictions

15 Dec, 2023
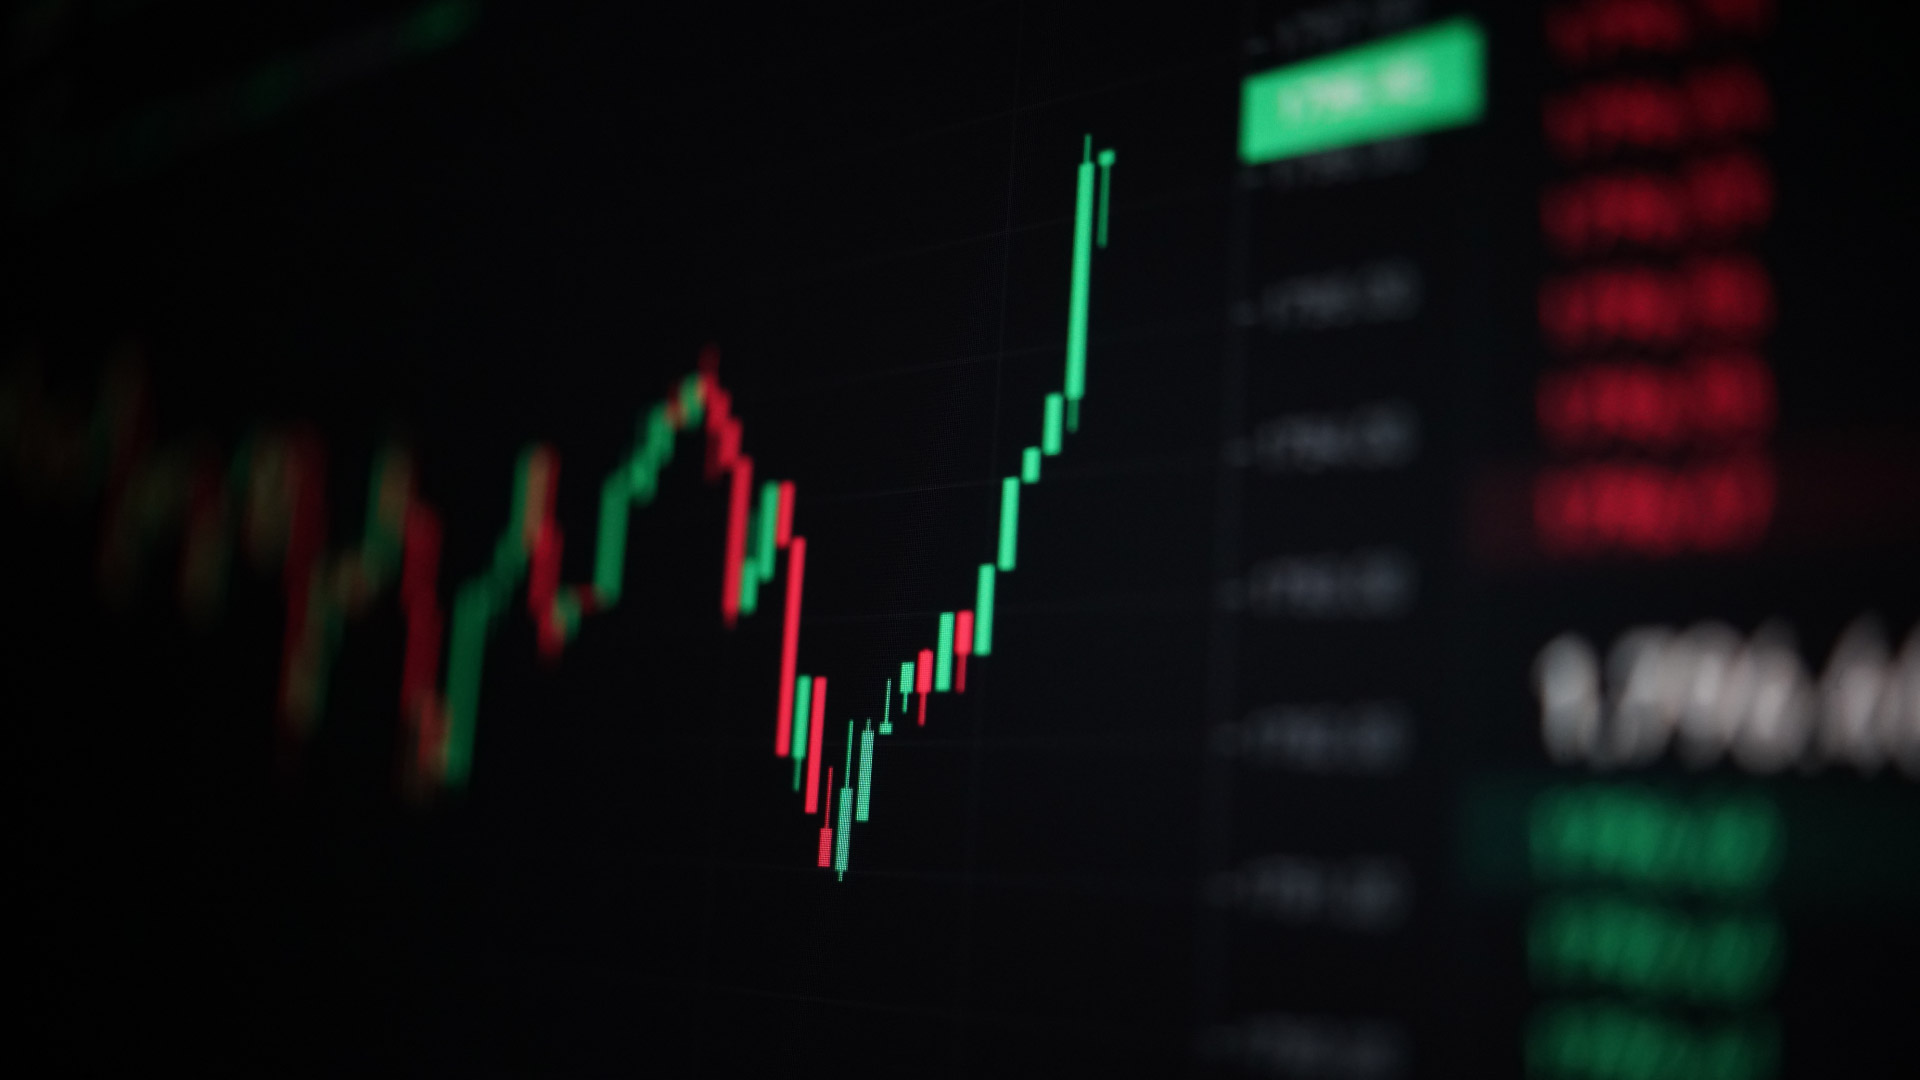
Stock market candlestick chart showing a sharp upward price movement, illustrating a short squeeze trading scenario.
Trading Strategies 5 min read

How to Trade a Short Squeeze?

15 Dec, 2023
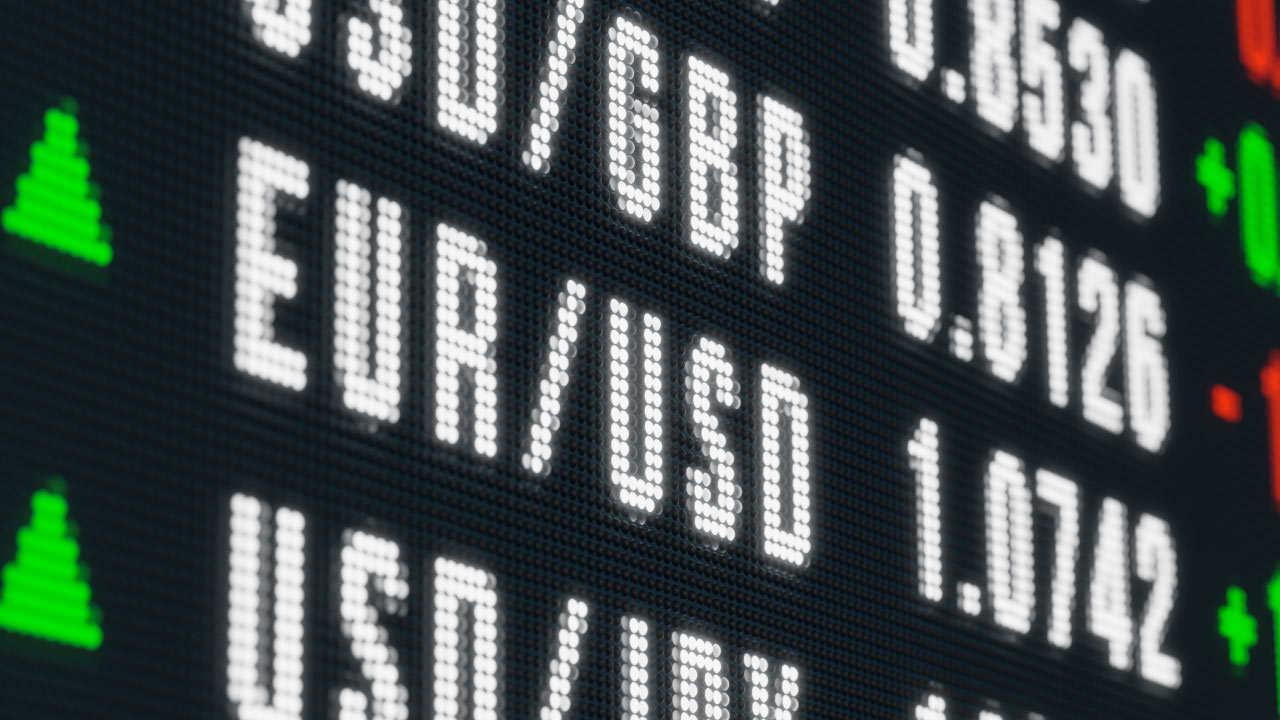
A digital forex display board showing currency pairs and exchange rates including USD/GBP, EUR/USD, and USD/JPY with green and red arrows indicating price movement directions.
Forex 3 min read

How Bond Yields Affect Currency Movements in Forex?

15 Dec, 2023
a group of four people, likely financial analysts or traders focused on multiple computer screens
Partnership 8 min read

How to attract Clients to your Introducing Brokers (IBs) Business through Social Media?

15 Dec, 2023
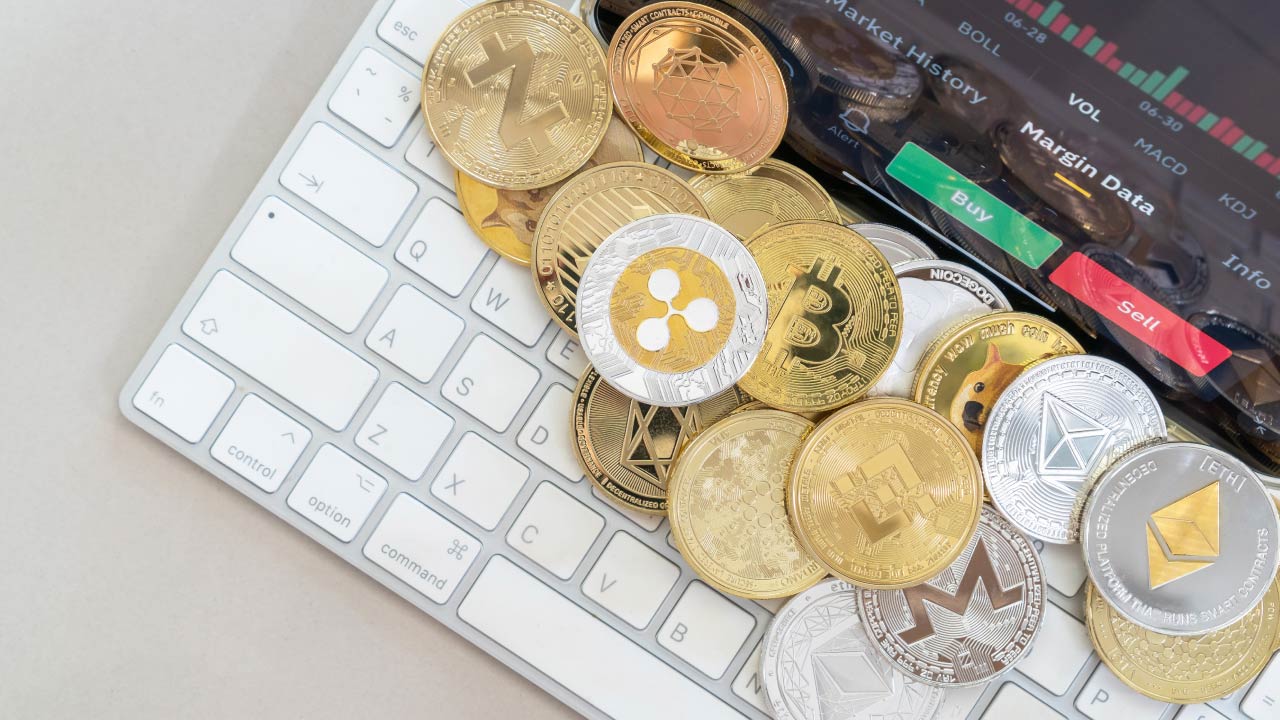
a collection of various physical cryptocurrency coins, including Bitcoin, Ethereum, Ripple, and Litecoin, placed on a white computer keyboard
Cryptocurrencies 5 min read

How to Invest in Crypto Without Buying Crypto?

15 Dec, 2023
man holding a tablet
Trading Strategies 4 min read

How To Set A Stop-Loss Based On Price Volatility?

15 Dec, 2023
Is Forex Trading Halal or Haram? – A man in traditional Middle Eastern attire analyzing financial charts with a trading platform open on a laptop, representing the discussion of forex trading in Islamic finance.
Forex 8 min read

Is Forex Trading Halal or Haram?

14 Dec, 2023
bitcoin with trading monitor as a background
Cryptocurrencies 4 min read

How To Cautiously Trade Cryptocurrencies?

13 Dec, 2023
Trading Zone photo with Jonathan Kibbler
Daily Forex Analysis 5 min read

How To Be A Better Forex Trader | In The Trading Zone

13 Dec, 2023
A professional trader in a suit analyzing financial charts on a desktop monitor and laptop, pointing at market trends with a pen. Top 8 Questions Introducing Brokers Need to Ask When Selecting a Broker.
Partnership 3 min read

Top 8 Questions Introducing Brokers Need to Ask When Selecting a Broker

11 Dec, 2023
Trading Strategies 8 min read

What is The Marubozu Candlestick Pattern?

11 Dec, 2023

What is the Petrodollar? A black oil barrel pouring crude oil onto a golden dollar sign, symbolizing the relationship between oil trading and the U.S. dollar in global markets.
Economic Indicator 5 min read

What is The Petrodollar?

11 Dec, 2023
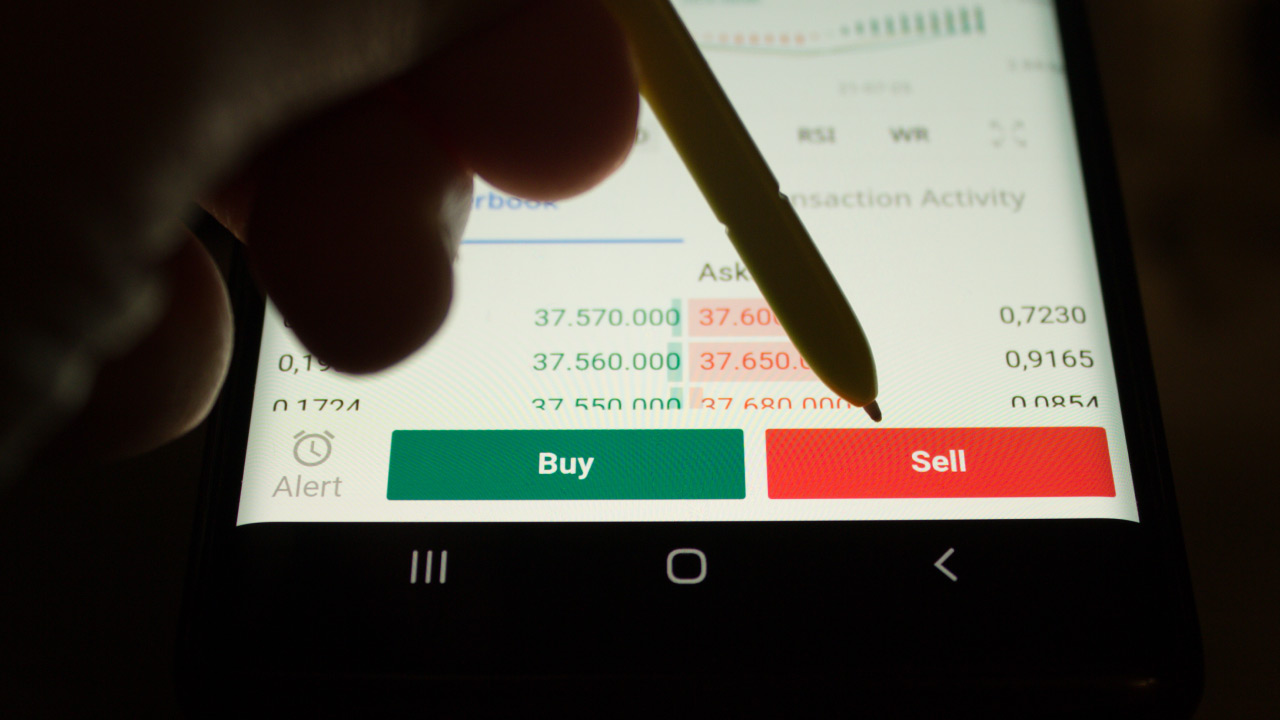
a mobile trading app screen showing the "Buy" and "Sell" options with a stylus
Trading Strategies 4 min read

How to Know When to Close a Trade

11 Dec, 2023
Wooden seesaw balancing blocks labeled RISK and REWARD, illustrating the concept of the risk-reward ratio in trading.
Forex 8 min read

What is the Risk-Reward Ratio?

11 Dec, 2023
Daily Forex Analysis 3 min read

How To Use Currency Strength Vs Weakness In Forex Trading

27 Nov, 2023
What is an Introducing Broker (IB)? A focused trader analyzes financial charts on multiple monitors, evaluating market movements and trading opportunities.
Partnership 5 min read

What is an Introducing Broker (IB)?

24 Nov, 2023
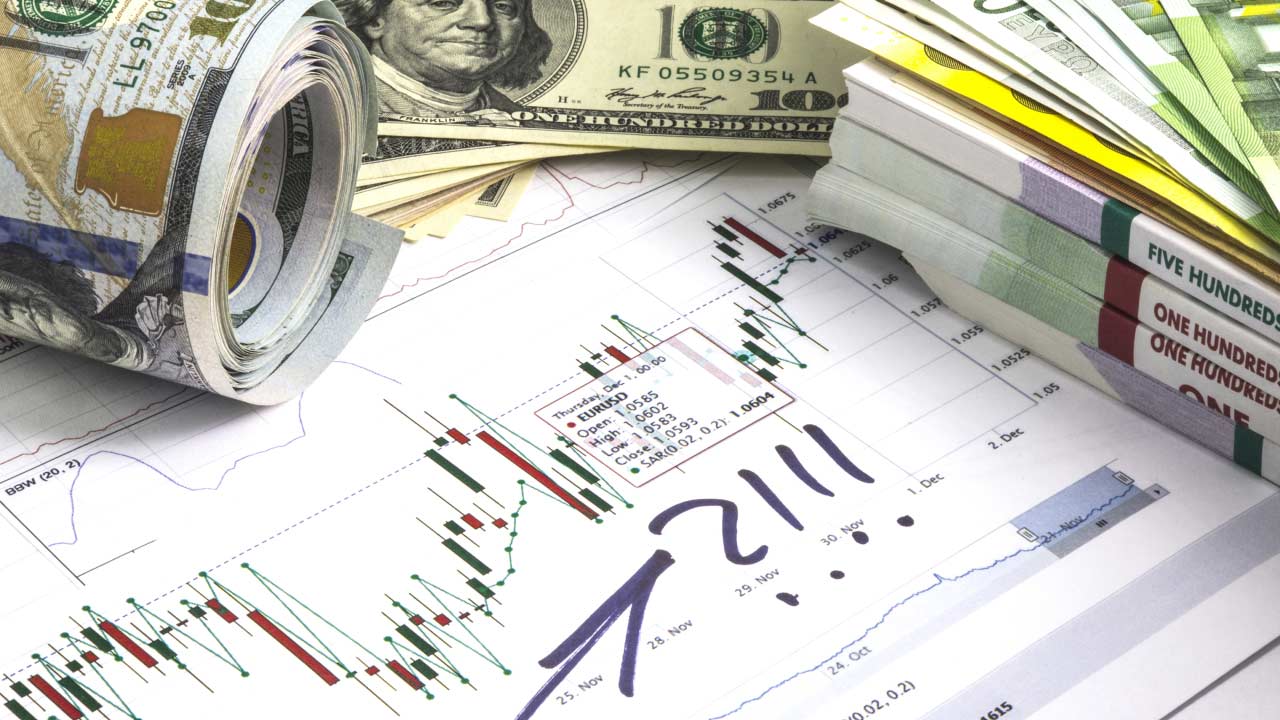
a financial trading chart with candlestick patterns, a handwritten upward arrow and exclamation marks
Forex 3 min read

How to Calculate Lot Size in Forex?

23 Nov, 2023
How Unemployment Rates Affect the Forex Market – Letter cubes spelling 'UNEMPLOYMENT' placed over economic charts, illustrating the relationship between job data and currency movements.
Economic Indicator 8 min read

How Do Unemployment Rates Affect The Forex Market?

23 Nov, 2023
a man in a business suit holding a red prohibition symbol above a stack of gold coins
Forex 3 min read

4 Big Mistakes Traders Make When Setting Stops

23 Nov, 2023

Wooden cutouts of various currency symbols
Forex 5 min read

Choosing Forex Pairs: A Comprehensive Guide

23 Nov, 2023
A close-up of a trader analyzing a candlestick chart with Bollinger Bands on a digital screen, using a pen to point at a specific price movement
Forex 5 min read

How to Study Your Losses to Realize Gains?

23 Nov, 2023
Scalping vs. Position Trading: Which is Right for You?, illustrated by a close-up of a laptop screen displaying a technical trading chart on a financial platform.
Trading Strategies 5 min read

Scalping vs. Position Trading: Which is Right for You?

23 Nov, 2023

Understanding the Relationship Between Oil and Currency, illustrated by a miniature oil pump jack and a black oil barrel placed on top of various global currencies.
Economic Indicator 5 min read

Understanding the Relationship Between Oil and Currency

23 Nov, 2023
Risk On Returns In The Forex Markets, illustrated by a promotional graphic for Blueberry Markets featuring the title 'Risk On Returns' in bold text.
Daily Forex Analysis 5 min read

Risk On Returns In The Forex Markets

22 Nov, 2023
Israeli and Palestinian flags side by side against a clear blue sky, symbolizing geopolitical tension and its impact on forex markets.
Forex 3 min read

What The Israel-Palestine Conflict Means For Forex Markets?

17 Nov, 2023
a percentage symbol (%) and an upward-pointing arrow
Economic Indicator 5 min read

How Does Inflation Affect The Interest Rates?

15 Nov, 2023
Online Trading vs Offline Trading: What's the Difference?, illustrated by two professionals analyzing financial charts on a laptop and document.
Trading Strategies 5 min read

Online Trading vs Offline Trading: What's the Difference?

15 Nov, 2023
A person pointing at a computer screen displaying a candlestick chart, illustrating when to move from a demo to a live forex trading account.
Forex 5 min read

When to Move from Demo to Live Forex Trading Account?

15 Nov, 2023
A close-up of a calendar displaying January 1st alongside financial charts, representing how traders can read and utilize the forex economic calendar for market analysis.
Forex 5 min read

How to Read and Leverage The Forex Economic Calendar

14 Nov, 2023
Hand holding a magnifying glass over a financial chart with candlestick patterns, analyzing trading signals for market trends. What Are Trading Signals & How Do They Work?
Trading Strategies 5 min read

What Are Trading Signals & How Do They Work?

14 Nov, 2023
Forex Trading and Taxes: What You Need to Know – Tax-related financial concept with a blue calculator, magnifying glass, coins, notebook, pen, and eyeglasses placed on a paper labeled 'TAX' with financial icons, highlighting tax implications for forex traders.
Forex 5 min read

Forex Trading and Taxes: What You Need to Know

13 Nov, 2023
Close-up image of a U.S. dollar bill, Euro coin, and stack of gold coins representing currency exchange and supply-demand dynamics in forex trading.
Forex 5 min read

Understanding Supply and Demand in Forex Trading

13 Nov, 2023
What is the FRA40 index? A financial chart displaying candlestick patterns and trend lines, representing market movements and trading activity in the FRA40 index.
CFD 8 min read

What is the FRA40 index?

10 Nov, 2023
How Central Banks Impact the Forex Market – A glass globe surrounded by stacks of gold coins, symbolizing the influence of central banks on global currencies and forex trading.
Forex 5 min read

How Central Banks Impact the Forex Market?

07 Nov, 2023
A forex trader celebrating a successful trade in front of multiple monitors displaying market charts, symbolizing the rewards of discipline and patience in trading.
Forex 5 min read

How to Maintain Forex Trading Discipline and Patience?

07 Nov, 2023
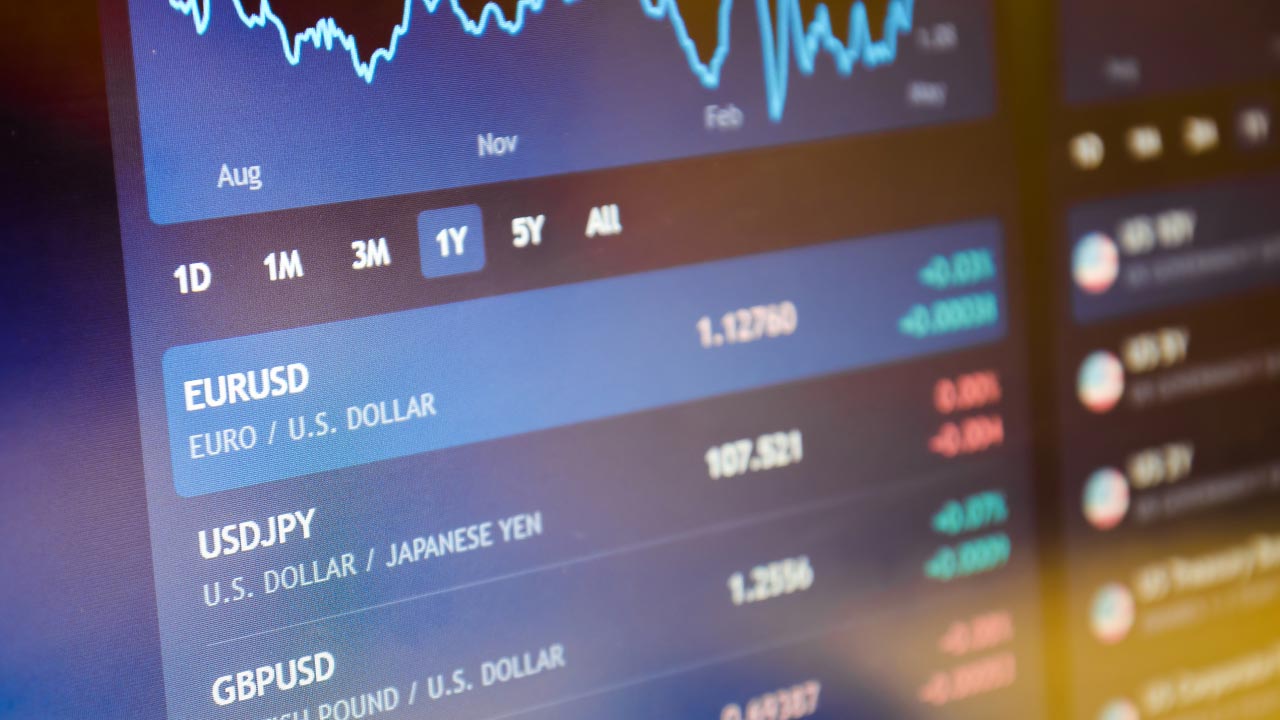
A digital forex trading screen displaying currency pairs like EUR/USD, USD/JPY, and GBP/USD, showing exchange rates and price movements for understanding forex trading quotes.
Forex 5 min read

How to Read And Understand Forex Trading Quotes

07 Nov, 2023
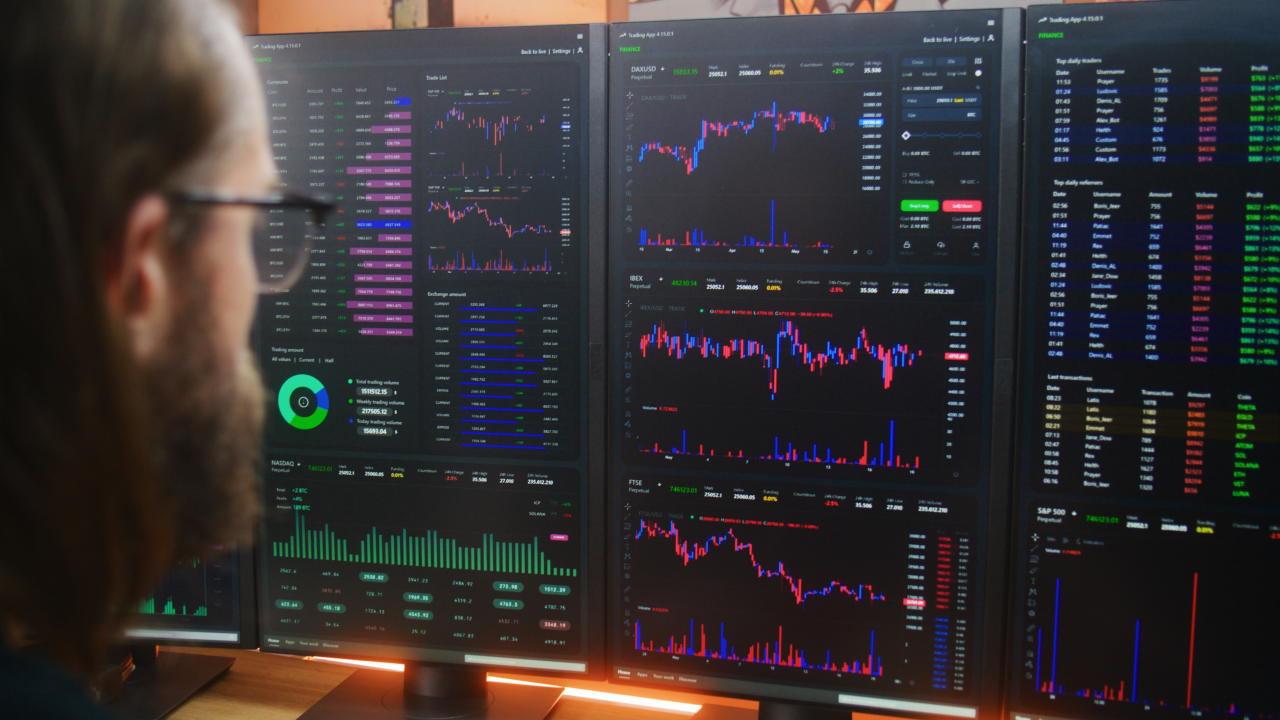
 A trader analyzing financial charts and data on multiple monitors, illustrating the concept of multi-asset trading across forex, stocks, and commodities.
Trading Strategies 5 min read

What is Multi-Asset Trading?

07 Nov, 2023
a financial trading chart with candlestick patterns and red moving average lines
Trading Strategies 5 min read

A Beginner's Guide to Hedging

07 Nov, 2023
 a smartphone displaying candlestick charts, a notebook, pen, and an analog clock
Trading Strategies 8 min read

How to Use a Trading Journal?

07 Nov, 2023
Top Strategies to Trade The Euro/British Pound, illustrated by a close-up of a one-pound coin stacked over a one-euro coin, symbolizing Euro and British Pound trading strategies.
Trading Strategies 8 min read

Top Strategies to Trade The Euro/British Pound

06 Nov, 2023
Black alarm clock surrounded by stacks of coins, symbolizing the connection between time and money.
Forex 8 min read

Forex Trading Hours: What is The Right Time to Trade?

27 Oct, 2023
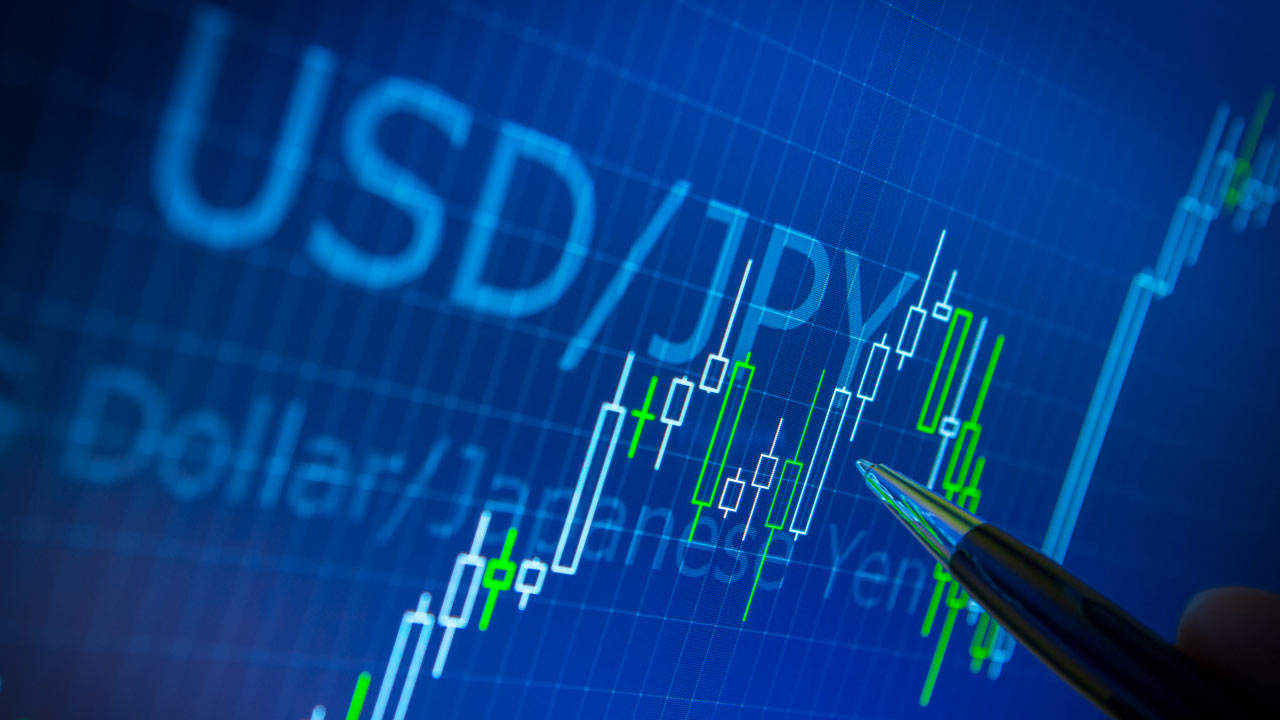
A forex trading screen displaying the USD/JPY currency pair with candlestick chart analysis, showing market trends and a pen pointing at price movements.
Forex 5 min read

The Forex Trader's Guide to USD/JPY Pair

26 Oct, 2023
Major Economic Reports That Affect the British Pound — a large golden British pound (£) symbol stands prominently in front of a glowing digital chart with fluctuating candlestick patterns, illustrating the impact of economic data on GBP movements.
Economic Indicator 5 min read

Major Economic Reports That Affect the British Pound

26 Oct, 2023
The Impact of BOJ on the Forex Market, illustrated by stacks of Japanese yen banknotes placed over the Japanese flag.
Forex 7 min read

The Impact of BOJ on the Forex Market

26 Oct, 2023
A robotic hand typing on a laptop keyboard with a trading chart displayed on the screen, symbolizing the creation of an AI trading bot using ChatGPT.
Trading Strategies 8 min read

How to Create an AI Trading Bot With ChatGPT?

25 Oct, 2023
Benefits and Risks of Using AI in Trading: A robotic hand interacting with a forex trading chart on a computer screen, symbolizing AI-driven trading strategies.
Trading Strategies 3 min read

Benefits And Risks of Using AI in Trading

18 Oct, 2023
A modern trading setup with multiple monitors displaying various financial charts with candlestick patterns and trading data.
Forex 5 min read

How to Switch Forex Brokers?

18 Oct, 2023
European Union flags and a Union Jack (United Kingdom flag) fly in front of a historic Gothic-style building, likely part of the UK Parliament in London.
Forex 8 min read

How to Trade the Euro/British Pound?

18 Oct, 2023
Forex 3 min read

How to Trade the EUR/AUD Currency Pairs?

17 Oct, 2023
Laptop displaying a glowing Japanese yen (¥) symbol among digital financial graphics
Forex 8 min read

How to Trade the Japanese Yen?

17 Oct, 2023
FTSE 100 vs FTSE 250: What’s The Difference? – A waving Union Jack flag in the foreground with Big Ben and the London cityscape in the background, symbolizing the UK financial markets and the distinction between major stock indices.
CFD 5 min read

FTSE 100 vs FTSE 250: What’s The Difference?

16 Oct, 2023
Risks Associated With Candlestick Chart Patterns – A trader analyzing a digital candlestick chart with a stylus, highlighting potential risks in technical analysis.
Trading Strategies 8 min read

Risks Associated With Candlestick Chart Patterns

16 Oct, 2023
A trader in a suit raising a red hand with 'STOP LOSS' written on it, symbolizing risk management in day trading, with a financial chart in the background.
Trading Strategies 5 min read

Stop-Loss Strategy For Day Trading

16 Oct, 2023
A professional trader stands in a modern office at night, illustrating five questions to ask your forex broker
Forex 5 min read

Five Questions to Ask Your Forex Broker

16 Oct, 2023
Hedging vs Speculation: Top Differences – A digital trading chart displaying candlestick patterns in red and blue, symbolizing market fluctuations and contrasting strategies in risk management and profit-seeking.
Trading Strategies 5 min read

Hedging vs Speculation: Top Differences

10 Oct, 2023
a robotic hand typing on a laptop keyboard with a stock market chart on the screen
Forex 3 min read

How to Use ChatGPT for Algorithmic Trading?

10 Oct, 2023
 A promotional banner from Blueberry Markets featuring a suited man, the Australian and Japanese flags connected by arrows
Daily Forex Analysis 3 min read

How To Analyze A Forex Chart: AUDJPY In Focus

10 Oct, 2023
calculator displaying inflation
Commodities 5 min read

The Correlation Between Commodities And Inflation

10 Oct, 2023
What is the NAS100 Index? A digital stock market board displaying financial data, price changes, and percentage movements in green and red, representing market fluctuations in indices like NASDAQ 100.
CFD 5 min read

What is the NAS100 Index?

09 Oct, 2023
Risk Management Strategies for Active Traders, illustrated by candlestick charts on a board with chess pieces symbolizing strategic decision-making.
Trading Strategies 5 min read

Risk Management Strategies for Active Traders

05 Oct, 2023
Risks of Automated Trading Systems, illustrated by a screen with charts, prices, bars, and buy and sell indicators.
Trading Strategies 5 min read

Risks of Automated Trading Systems

04 Oct, 2023
a financial chart showing a bullish market trend which features blue candlesticks indicating price movement
Forex 4 min read

How to Make the Most of Your Brokerage Account

04 Oct, 2023
How Does GDP Affect Forex Trading? A candlestick chart displaying market trends with moving averages, illustrating the impact of GDP on currency valuation.
Forex 5 min read

How Does GDP Affect Forex Trading?

02 Oct, 2023
A close-up of a financial balance sheet with a fountain pen resting on it, illustrating how traders can analyze financial statements for informed trading decisions.
Economic Indicator 5 min read

How to Read a Balance Sheet For Trading?

02 Oct, 2023
USD/CAD currency pair chart displaying candlestick patterns and percentage changes, illustrating market fluctuations influenced by economic and geopolitical factors.
Forex 5 min read

What Are the Factors Affecting USD/CAD?

02 Oct, 2023
Silhouettes of oil pump jacks at sunset with an overlay of a rising bar and line graph, symbolizing increasing oil prices and production.
Forex 8 min read

How Oil Impacts The Canadian Dollar?

02 Oct, 2023
CFDs vs Futures: What Are The Differences? – A financial chart displaying candlestick patterns with fluctuating price levels, illustrating market movements and the key differences between CFDs and futures trading.
CFD 5 min read

CFDs vs Futures: What Are The Differences?

20 Sep, 2023
Futuristic cityscape with glowing network connections representing Forex VPS hosting and high-speed trading infrastructure.
Forex 8 min read

What is Forex VPS Hosting: A Comprehensive Guide

08 Sep, 2023
coins in gold background
CFD 8 min read

How to Trade Crypto CFDs?

08 Sep, 2023
Trader analyzing stock market charts on a laptop with financial graphs overlay, illustrating how CPI affects the stock market.
Economic Indicator 5 min read

How Does CPI Affect the Stock Market?

06 Sep, 2023
A 10-ounce gold bar resting on the American flag, representing the impact of Non-Farm Payroll (NFP) data on the price of gold.
Commodities 8 min read

How Does NFP Affect the Price of Gold?

06 Sep, 2023

Seasonal Market Patterns for EUR/USD – A close-up of overlapping U.S. dollar and euro banknotes, symbolizing forex market trends and seasonal price movements.
Forex 5 min read

Seasonal Market patterns For EUR/USD

06 Sep, 2023
A hand stopping falling coin stacks overlaid with a financial candlestick chart, highlighting the concept of risk management. Labels for 'Stop Loss' and 'Cut Loss' emphasize differences between hedging and stop-loss strategies.
Forex 5 min read

Top Differences Between Hedging and Stop-loss

06 Sep, 2023
What is the best setup for trading? A futuristic cityscape with glowing digital grid lines and data streams, symbolizing advanced trading infrastructure and market connectivity.
Trading Strategies 8 min read

What is The Best Setup For Trading?

06 Sep, 2023
Top Industries in FRA40 Index, illustrated by the stock market on an LED display screen.
CFD 5 min read

Top Industries in FRA40 Index

06 Sep, 2023
A digital trading screen displaying stock indices, including the Euro Stoxx 50, Nasdaq 100, FTSE 100, and DAX, with green and red indicators showing market movements.
CFD 5 min read

The Complete Guide to Euro Stoxx 50 Index

05 Sep, 2023
DAX 30 Index displayed on a digital trading screen with a green upward triangle indicating a rise in value.
CFD 5 min read

What is DAX 30 Index?

05 Sep, 2023
Facade of the OPEC headquarters, illustrating the concept of OPEC and how it influences oil prices.
Commodities 8 min read

What is OPEC, and How Does it Influence Oil Prices?

25 Aug, 2023
businessman using a smartphone with an AI symbol overlay
Trading Strategies 5 min read

How Will AI Impact Trading

24 Aug, 2023
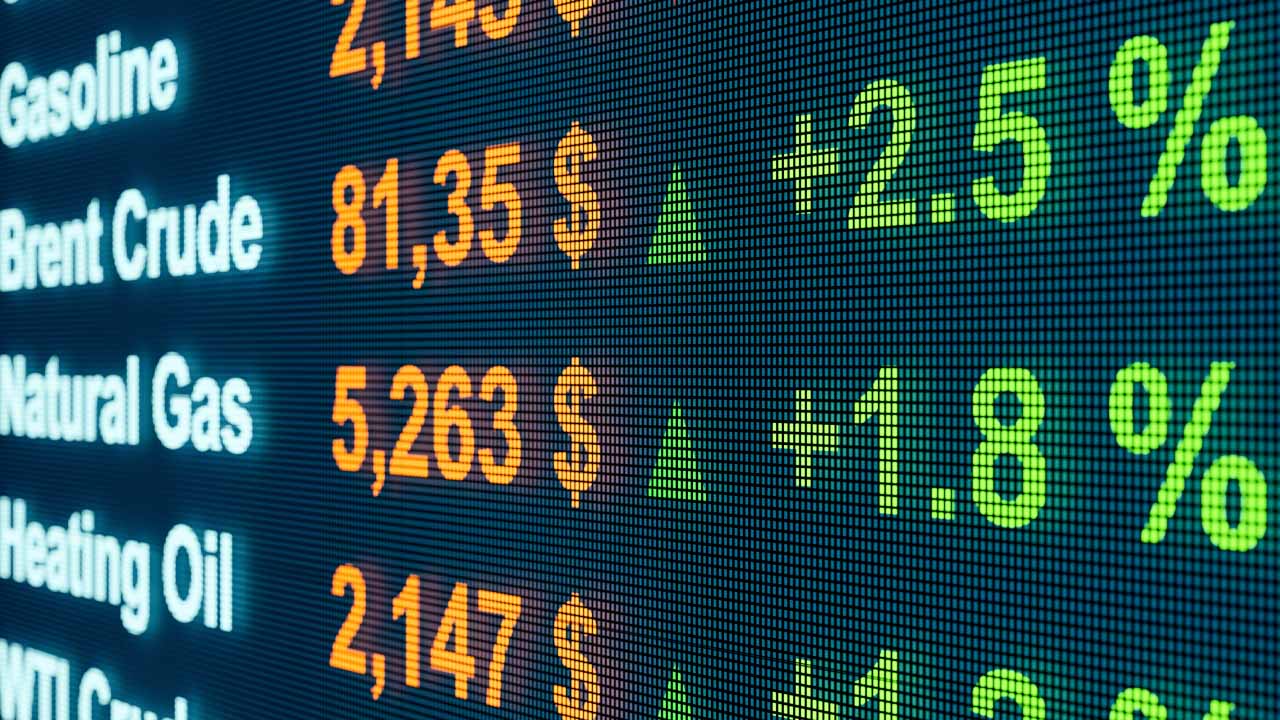
A digital commodities price board displaying rising prices for gasoline, Brent crude, natural gas, heating oil, and WTI crude with green upward arrows and percentage increases.
Commodities 8 min read

How Can Oil Prices Affect Stock Prices?

23 Aug, 2023
a robot hand interacting with a laptop analyzing trading charts
Trading Strategies 4 min read

How to Use ChatGPT For Trading?

10 Aug, 2023
A human hand and a robotic hand reaching toward each other with a financial candlestick chart overlay. Top AI Tools for Trading.
Forex 8 min read

Top AI Tools for Trading

10 Aug, 2023
How Does GDP Affect the Stock Market? Wooden blocks spelling 'GDP' in front of a stock market chart, illustrating what GDP is and how it impacts stock prices and investor sentiment.
Economic Indicator 5 min read

How Does GDP Affect the Stock Market?

09 Aug, 2023
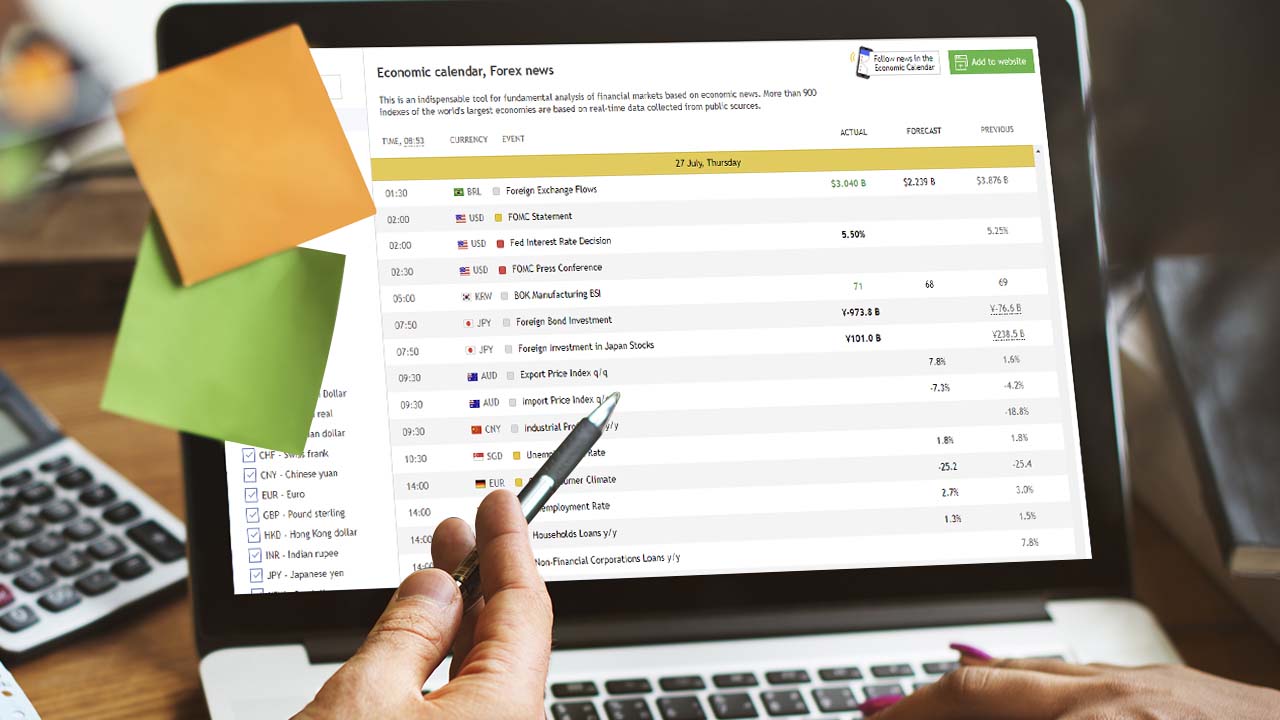
Forex Economic Calendar for 2023 – A trader analyzing upcoming market events on a laptop screen, with key financial indicators and currency impacts displayed.
Forex 5 min read

Forex Economic Calendar for 2023

31 Jul, 2023
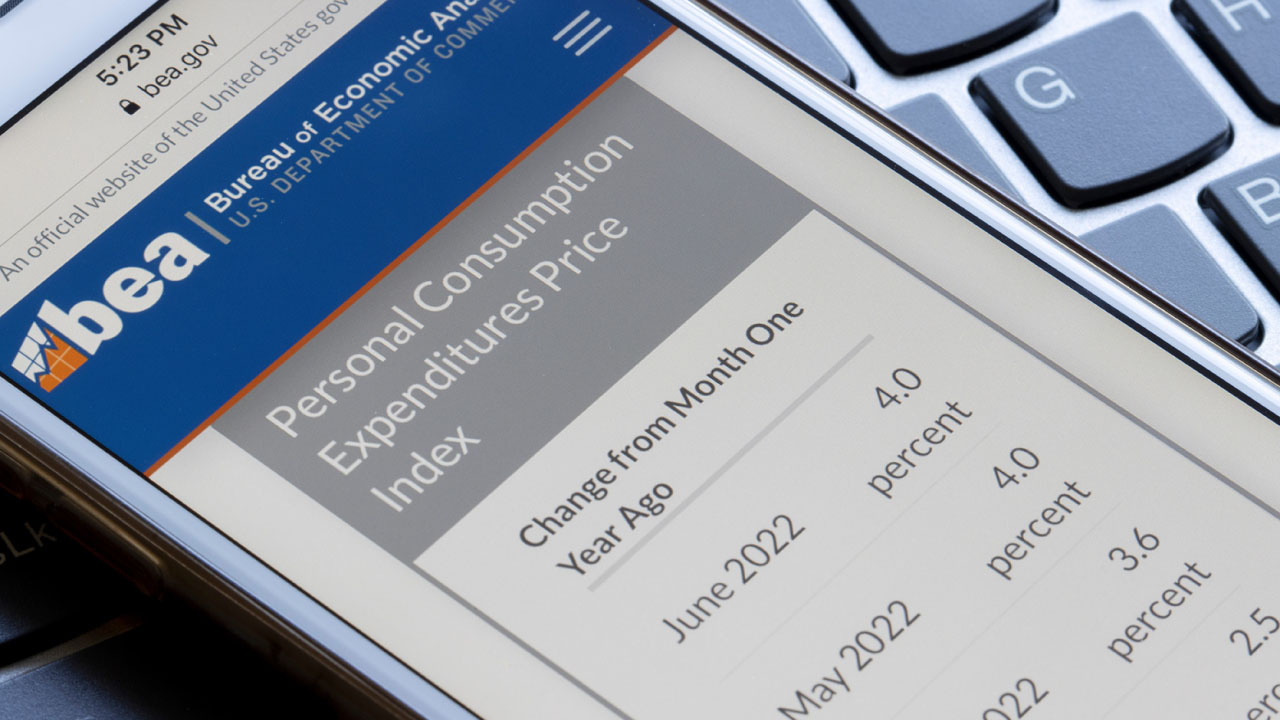
What is Core PCE and How Does it Affect the Forex Market? A smartphone screen displaying the Bureau of Economic Analysis website with the Personal Consumption Expenditures Price Index, a key economic indicator.
Economic Indicator 5 min read

What is Core PCE and How Does it Affect the Forex Market?

31 Jul, 2023
A metallic globe surrounded by major currency symbols (GBP, EUR, USD, JPY) on a dark background with the word 'News' embossed, representing key economic news events impacting forex trading.
Economic Indicator 5 min read

Top Economic News Events for Forex Trading

25 Jul, 2023
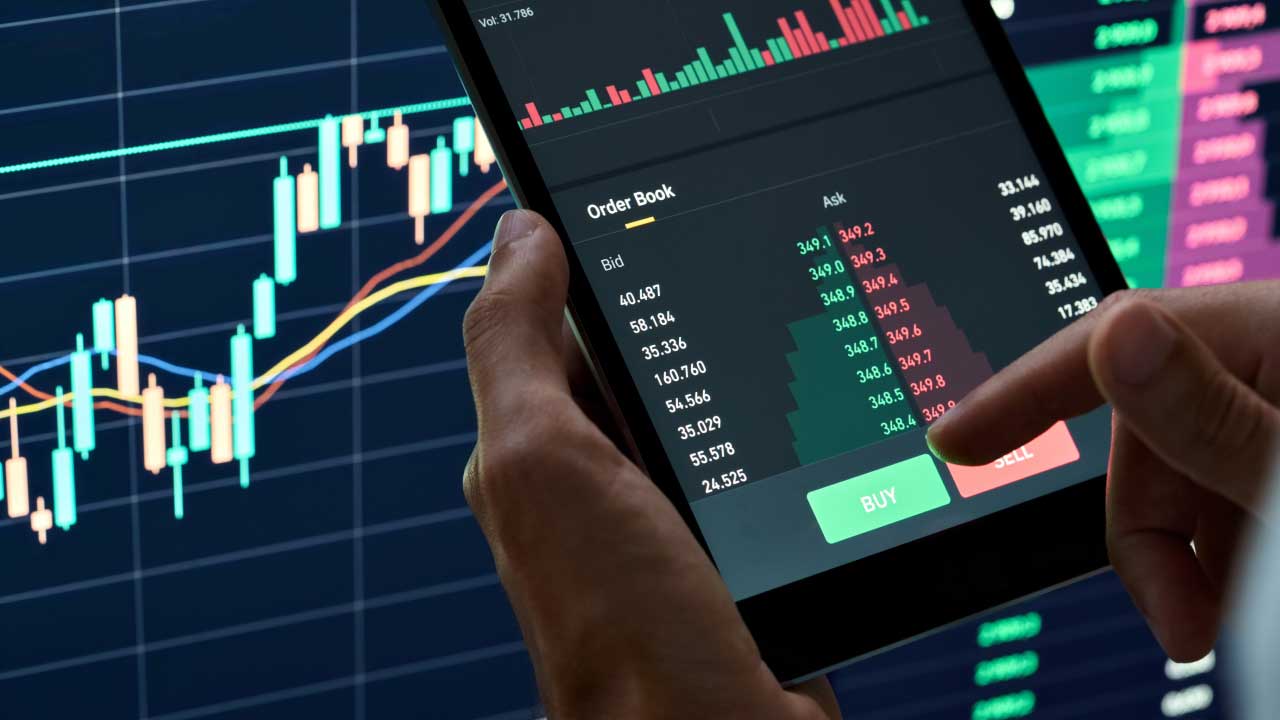
A phone with a hand pointing at the screen, displaying charts and candlesticks, illustrating what the Volatility Index (VIX) is and how to trade it.
Forex 5 min read

What is Volatility Index (VIX) And How Do You Trade It?

25 Jul, 2023
S\&P 500 Index, illustrated by the S\&P 500 index displayed on a digital stock market screen.
Forex 8 min read

S&P 500 Index

20 Jul, 2023
A red stock market chart with a downward trend, symbolizing the impact of a recession on the stock market.
Forex 8 min read

How Does The Recession Affect The Stock Market?

18 Jul, 2023
ADP National Employment Report represented with a futuristic financial chart displaying blue bar graphs and a fluctuating trend line on a digital grid background.
Forex 5 min read

What is ADP National Employment Report?

18 Jul, 2023
Image of a stock market display with ticker symbols, including SSE, representing the Shanghai Index and its performance.
Forex 5 min read

What is the Shanghai Index?

18 Jul, 2023
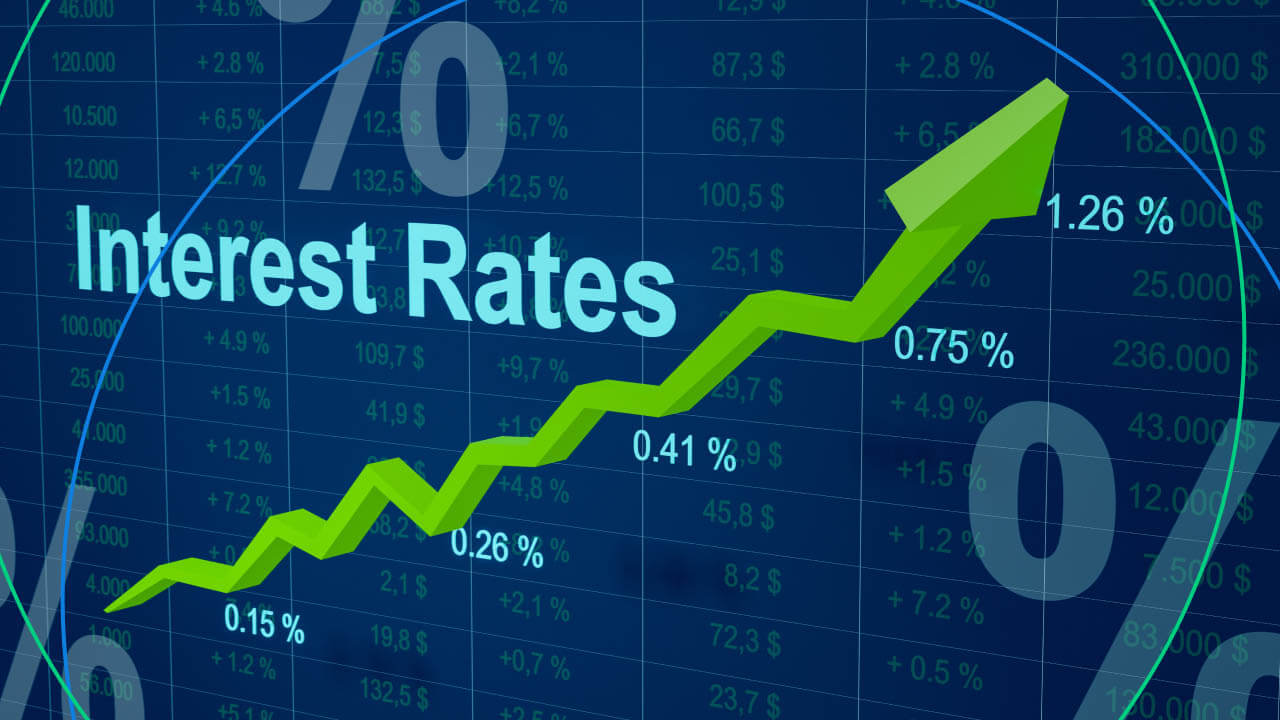
A rising green arrow labeled with increasing percentages from 0.15% to 1.26% overlays a digital financial chart background
Forex 5 min read

How Does Inflation Affect the Forex Market?

13 Jul, 2023
a stylized financial chart with glowing candlestick patterns and a bright pink trendline
MetaTrader 7 min read

How To Get The News Feed In MT4?

12 Jul, 2023
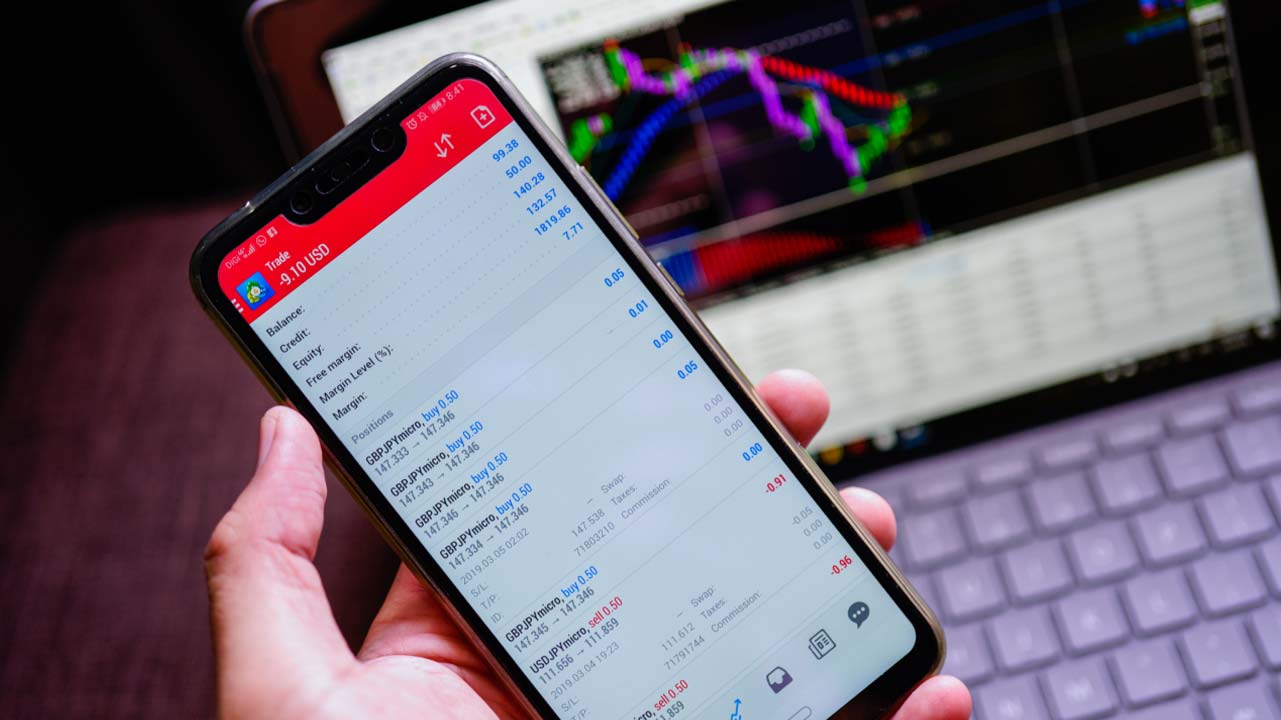
a person holding a smartphone displaying a trading app with a live account balance
MetaTrader 6 min read

How To Set Up MetaTrader? Step-By-Step Instruction

11 Jul, 2023
Can You Use MetaTrader 4 Without A Broker? – A trader analyzing multiple monitors displaying real-time forex and stock market data, representing the functionality of MetaTrader 4 and its potential use without a broker.
MetaTrader 3 min read

Can You Use MetaTrader 4 Without A Broker?

07 Jul, 2023
A person using a laptop displaying the MetaTrader 4 (MT4) trading platform
MetaTrader 7 min read

How to Copy a Trade on MT4?

07 Jul, 2023
a computer screen and mobile phone displaying a financial trading platform
MetaTrader 6 min read

Is MetaTrader 4 Good For Beginners?

07 Jul, 2023
A digital financial chart with a glowing blue wave and candlestick patterns, symbolizing the process of adding templates to MT4 for enhanced trading strategies.
MetaTrader 5 min read

How to Add Templates to MT4?

05 Jul, 2023
Type of Orders in Metatrader, illustrated by a trading platform displayed on a computer screen with candlestick patterns.
MetaTrader 10 min read

Type of Orders in Metatrader

30 Jun, 2023
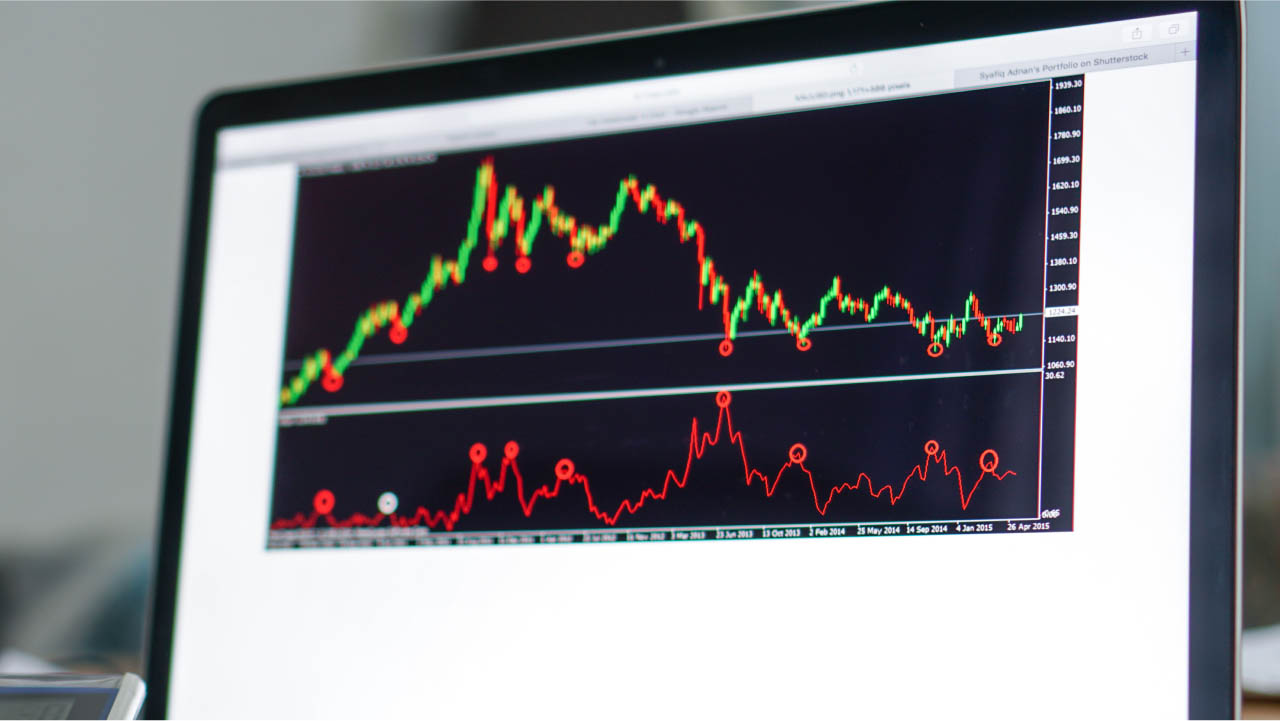
a computer screen displaying a trading chart with green and red candlesticks
MetaTrader 8 min read

How To Speed Up MT4?

29 Jun, 2023
Understanding the Fear and Greed Index: A Comprehensive Guide for Forex Traders, illustrated by an abstract financial chart with candlestick patterns and price data, representing market sentiment analysis for forex trading.
Forex 8 min read

Understanding the Fear and Greed Index: A Comprehensive Guide for Forex Traders

29 Jun, 2023
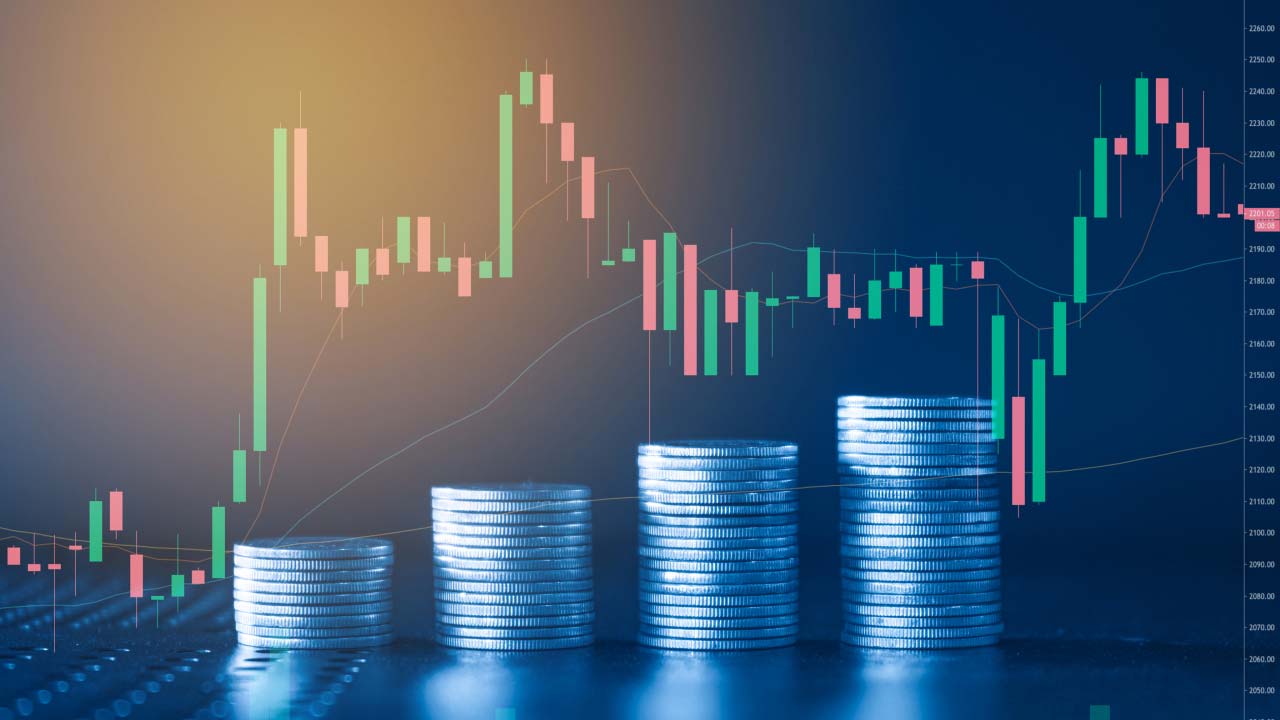
Stacks of coins with a financial candlestick chart overlay, illustrating market analysis and price movement, related to setting price alerts with MetaTrader 4.
MetaTrader 8 min read

How Do You Set Price Alerts With MetaTrader 4?

21 Jun, 2023
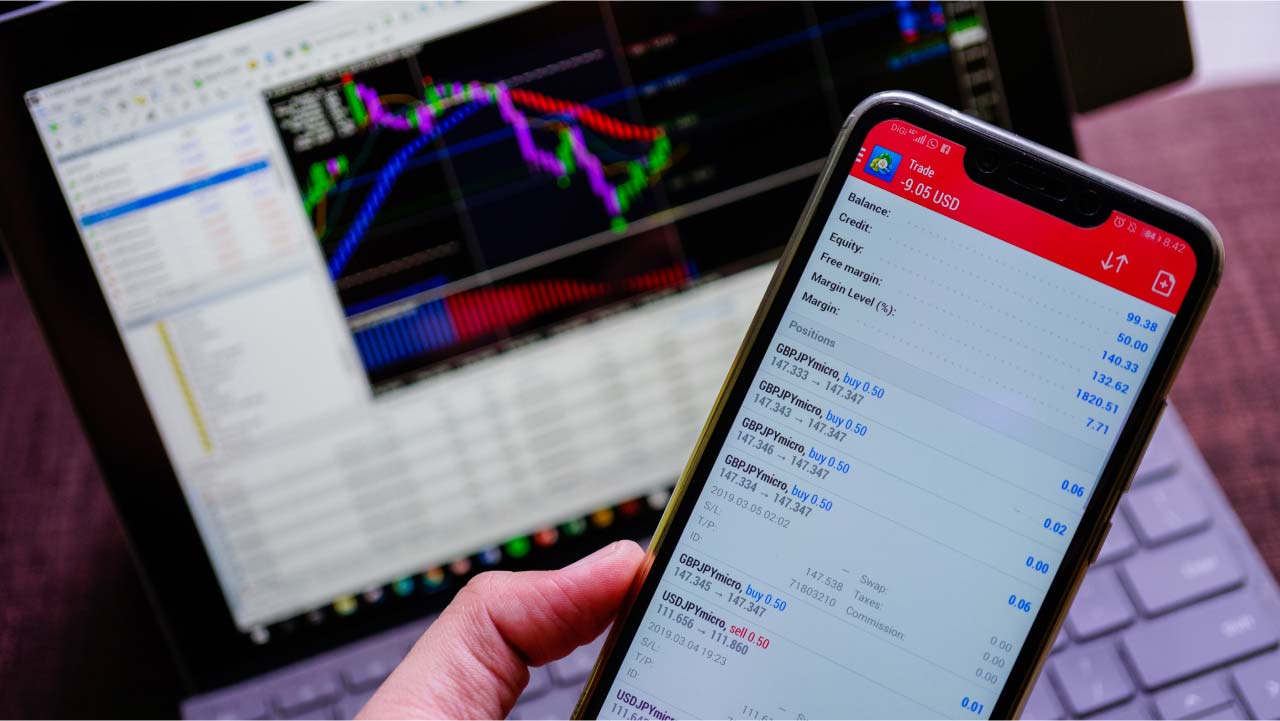
How Does MetaTrader 4 Work? A trader using the MetaTrader 4 platform on a smartphone, displaying open forex positions, with a trading chart on a laptop in the background.
MetaTrader 5 min read

How Does MetaTrader 4 Work?

21 Jun, 2023
Trading platform screen displaying multiple technical indicators and price charts, illustrating how to add commodities to MT4 for market analysis.
MetaTrader 8 min read

How to Add Commodities to MT4?

21 Jun, 2023
A hand interacting with a digital financial chart, representing the process of adding indices to MT4 for trading and market analysis.
MetaTrader 2 min read

How to Add Indices to MT4?

21 Jun, 2023
Understanding the Japanese Stock Market: Insights for Vietnamese Investors, illustrated by an abstract representation of the Japanese stock market with data charts, candlestick patterns, and trading volume bars in a blue digital interface.
Forex 8 min read

Understanding the Japanese Stock Market: Insights for Vietnamese Investors

20 Jun, 2023
a computer screen displaying a financial trading platform with a chart
MetaTrader

How to Use MetaTrader 4

19 Jun, 2023
Dos and Don'ts of Forex Trading in Vietnam – A financial market chart overlaid with the Vietnamese flag and upward green arrows, symbolizing trading activity and market trends in Vietnam.
Forex 5 min read

Dos and Don'ts of Forex Trading in Vietnam

18 Jun, 2023
Hand holding a pen pointing at a digital financial chart with various technical indicators and candlestick patterns on a blue screen, illustrating the concept of the Nikkei 225.
Forex 8 min read

What is Nikkei 225?

18 Jun, 2023
Managing Risk When Investing in the Tokyo Stock Exchange from Vietnam — illustrated by an electronic display board showing Japanese stock market listings with company names, ticker symbols, and numerical data including stock prices and daily changes.
Forex 5 min read

Managing Risk When Investing in the Tokyo Stock Exchange from Vietnam

15 Jun, 2023
close-up of a financial trading chart displayed on a dark screen showing red and green candlesticks
Forex 4 min read

How to Open a Trading Account to Invest in the Tokyo Stock Exchange from Vietnam

15 Jun, 2023
Top Industries to Invest in on the Tokyo Stock Exchange for Vietnamese Investors, illustrated by an aerial view of a large industrial complex with pipelines and illuminated structures, representing industrial investment opportunities.
Forex 5 min read

Top Industries to Invest in on the Tokyo Stock Exchange for Vietnamese Investors

12 Jun, 2023
 a person wearing a dark blue suit and striped tie is holding and counting a stack of Vietnamese đồng banknotes
Forex 4 min read

Common Mistakes When Exchanging Foreign Currency to Vietnamese Dong

09 Jun, 2023
Tips on Exchange Rate When Exchanging Foreign Currency to Vietnamese Dong, illustrated by a close-up of a financial graph showing rising and falling lines with bar charts on a blue background.
Forex 5 min read

Tips on Exchange Rate When Exchanging Foreign Currency to Vietnamese Dong

07 Jun, 2023
A person withdrawing and counting Vietnamese dong banknotes at an ATM, illustrating what traders need to know about fees when exchanging foreign currency to VND.
Forex 5 min read

What traders need to know about fees when exchanging foreign currency to Vietnamese dong

07 Jun, 2023
a scattered collection of Vietnamese đồng banknotes in various denominations
Forex 4 min read

5 Guides for Exchanging Foreign Currency to Vietnamese Dong Without Getting Scammed

05 Jun, 2023
The Ultimate Guide to The Tokyo Stock Exchange, illustrated by a digital display of stock market data with large text 'NIKKEI 225' overlaid, featuring red and green trading graphs.
Forex 7 min read

The Ultimate Guide to The Tokyo Stock Exchange

02 Jun, 2023
Exchanging Foreign Currency to Vietnamese dong: Pros And Cons – A digital foreign exchange rate display featuring the Vietnamese dong (VND) with a value of 0.0011, alongside country flags and other currency rates.
Forex 5 min read

Exchanging Foreign Currency to Vietnamese Dong: Pros And Cons

01 Jun, 2023
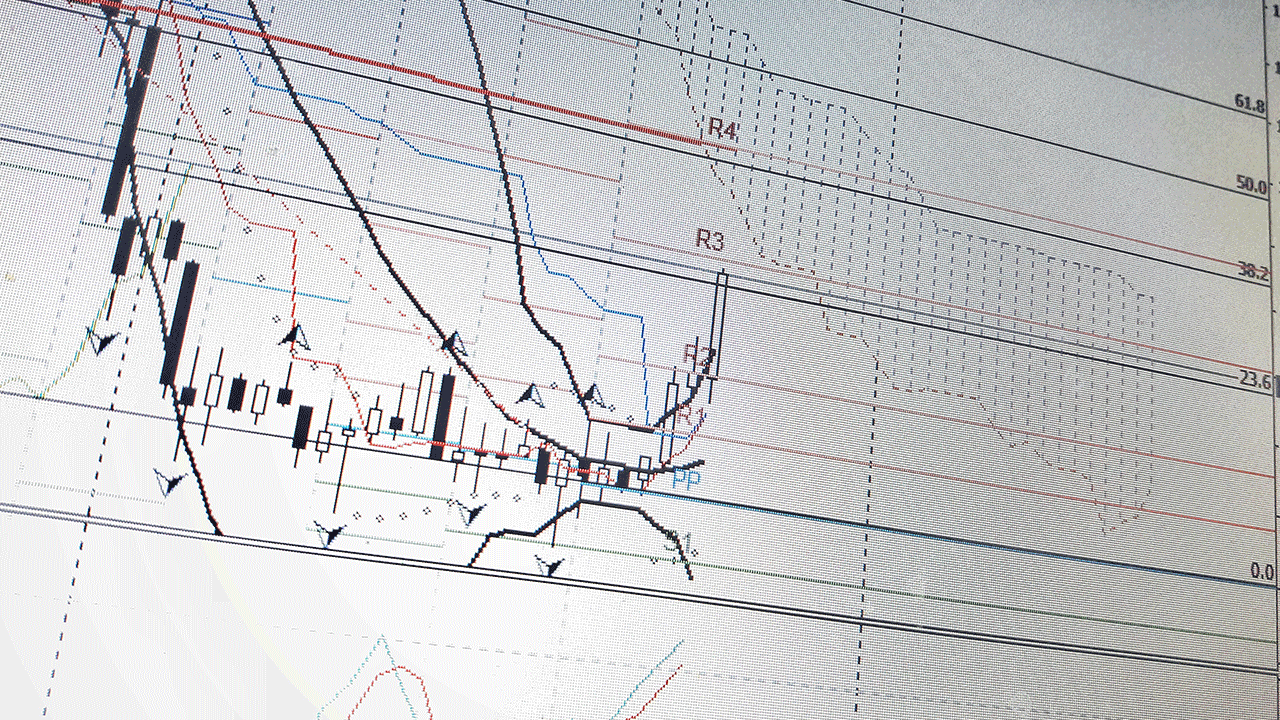
a complex trading chart featuring candlestick patterns & Fibonacci retracement levels
MetaTrader 13 min read

Basic Functions of MT4

23 May, 2023
a smartphone screen displaying the MetaTrader 4 app installation page on a digital marketplace
MetaTrader 8 min read

Customizing MT4 Interface: Tips and Tricks

23 May, 2023
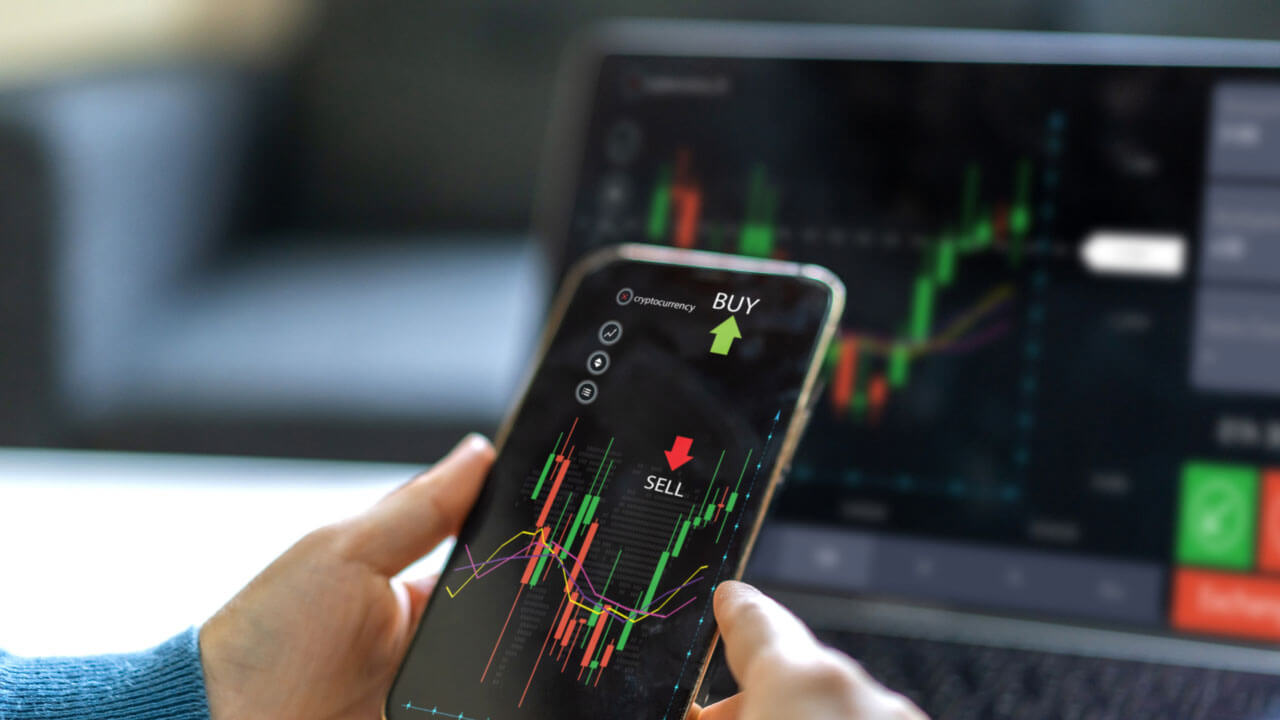
Trader holding a smartphone displaying a forex trading app with buy and sell indicators, analyzing market charts with a laptop in the background. Top 10 Essential MT4 Indicators for Technical Analysis.
MetaTrader 5 min read

Top 10 Essential MT4 Indicators for Technical Analysis

09 May, 2023
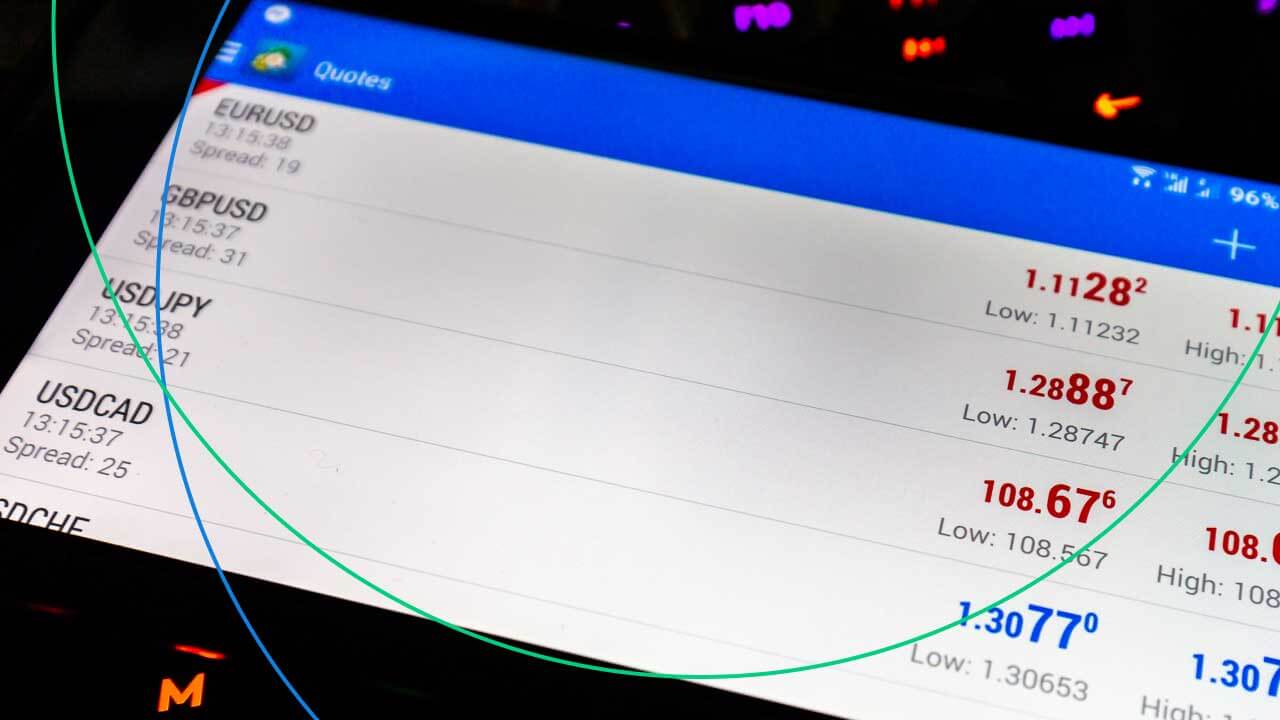
The Advantages of Using MT4 for Forex Trading, illustrated by a screen displaying forex charts with highs and lows.
MetaTrader 8 min read

The Advantages of Using MT4 for Forex Trading

09 May, 2023
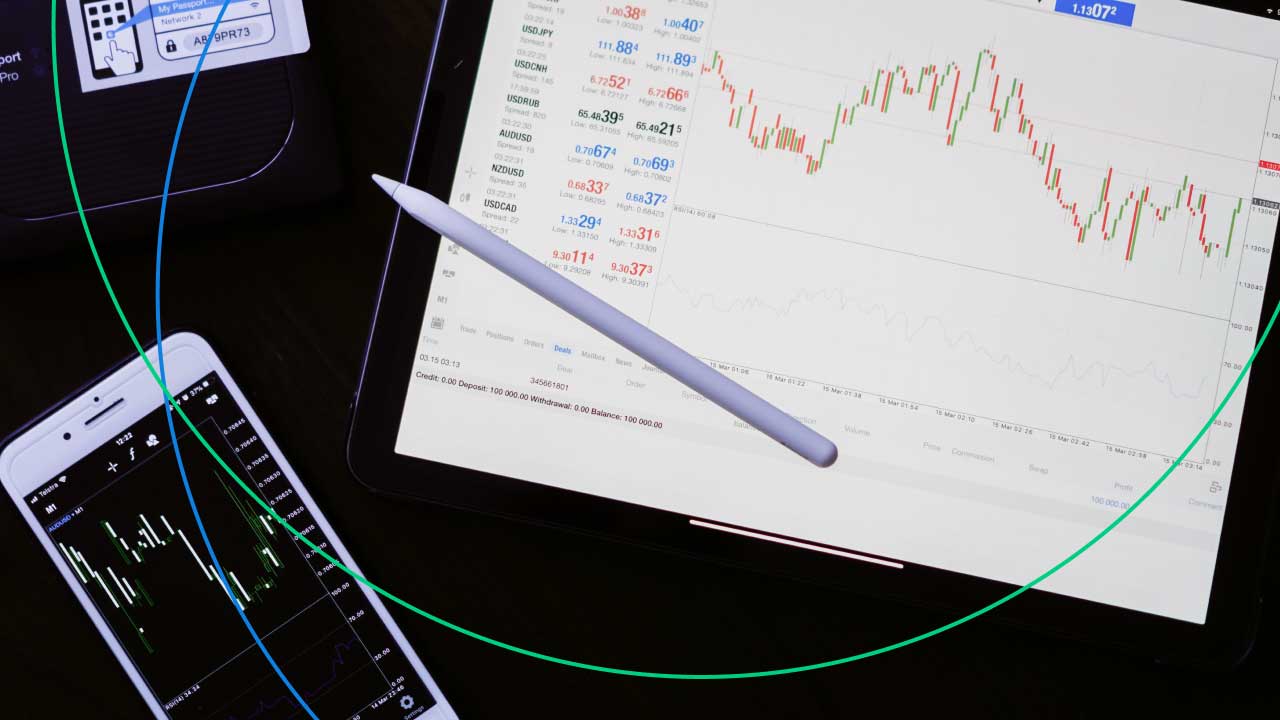
A Comprehensive Guide to MT4 Trading for Beginners, featuring a tablet and smartphone displaying forex trading charts.
MetaTrader 5 min read

A Comprehensive Guide to MT4 Trading for Beginners

01 May, 2023
 a financial trading chart with multiple candlesticks in blue, overlaid with trend lines
MetaTrader 7 min read

How to Optimize MT4 Trading Experience

01 May, 2023
A trader in a suit talking on the phone while monitoring multiple financial charts, illustrating the concept of the Purchasing Manager's Index.
Trading Strategies 5 min read

What is Purchasing Manager's Index?

24 Apr, 2023
Digital representation of global currencies with floating symbols of dollar, euro, yen, and bitcoin over a blue-toned world map, illustrating the 15 strongest currencies in the world.
Trading Strategies 8 min read

15 Strongest Currencies in The World

17 Apr, 2023
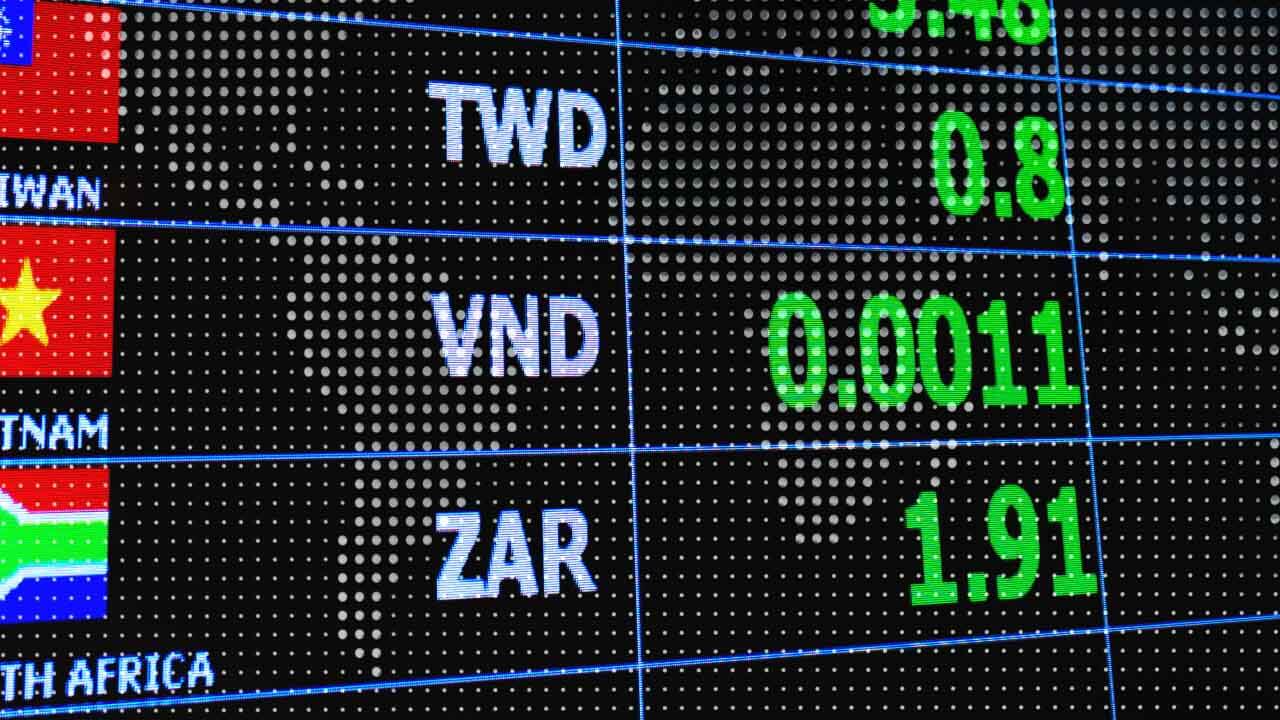
A Beginner's Guide to Exchanging Foreign Currency to Vietnamese Dong, featuring a digital currency exchange board displaying VND rates.
Forex 5 min read

A Beginner's Guide to Exchanging Foreign Currency to Vietnamese Dong

06 Apr, 2023
a digital abstract image showing a colorful financial trading chart with red and green candlesticks
Trading Strategies 4 min read

Buying The Dip: What Does it Mean?

16 Mar, 2023
Popular Trading Tools for New Traders, illustrated by a business professional interacting with digital financial charts and graphs.
Trading Strategies 5 min read

Popular Trading Tools for New Traders

07 Mar, 2023
Gold Price Forecast for 2023 – A stack of gold bars against a dark background with fluctuating financial charts, representing gold market trends and price predictions.
Commodities 5 min read

Gold Price Forecast for 2023

05 Mar, 2023
An image showing gold on a blue background, illustrating Forex Chart of the Day: is gold heading to \$1800.00?
Daily Forex Analysis 3 min read

Forex Chart Of The Day: Is Gold Heading To $1800.00?

22 Feb, 2023
 dual computer monitors displaying forex trading charts with a gaming PC setup
MetaTrader 8 min read

How to Open a MetaTrader 5 Account

15 Feb, 2023
Automated Trading vs Manual Trading: A trader analyzing forex charts on multiple screens while taking notes.
Trading Strategies 5 min read

Automated Trading vs Manual Trading

08 Feb, 2023
A 200g gold bar with '999.9 Fine Gold' engraving, overlaid on a financial market background with stock charts and trading data, symbolizing key factors influencing gold prices.
Commodities 5 min read

Top Factors That Affect Gold Prices

23 Jan, 2023
a person wearing a denim shirt is seen from above, sitting comfortably and using a laptop to monitor financial charts
Forex 5 min read

How to Become a Part-Time Forex Trader

19 Jan, 2023
Top Forex Trends For 2023, illustrated by a rising bar chart with a yellow upward arrow pointing to '2023' against a dark blue background with glowing lights.
Forex 5 min read

Top Forex Trends For 2023

10 Jan, 2023

A metallic bear figurine placed on a black keyboard with a key labeled 'CFD,' symbolizing contract for difference (CFD) trading and market trends.
Trading Strategies 8 min read

The Ultimate CFD Day Trading Guide

21 Dec, 2022
Cryptocurrencies to Focus on in 2023 – A collection of digital coins featuring Bitcoin, Ethereum, Litecoin, and other altcoins, symbolizing the evolving landscape of the cryptocurrency market.
Cryptocurrencies 8 min read

Cryptocurrencies to Focus on in 2023

06 Dec, 2022
Financial trading chart showcasing grid trading strategy with multiple buy and sell levels marked on a fluctuating price graph.
Trading Strategies 5 min read

What is Grid Trading?

01 Dec, 2022
Russian Ruble Financial Crisis 2022
Trading Strategies 5 min read

Russian Ruble Financial Crisis 2022: What to Expect?

22 Nov, 2022
rising light green arrow indicating increasing interest rates with percentages
Trading Strategies 5 min read

How Do Interest Rates Affect The Stock Market?

15 Nov, 2022
Blue-toned forex candlestick chart displaying price fluctuations within a defined range, illustrating market consolidation. What is a Ranging Market?
Trading Strategies 8 min read

What is a Ranging Market?

08 Nov, 2022
Trading Strategies 3 min read

How to Use RSI for Intraday Trading

02 Nov, 2022
a trading platform screen showing various technical indicators and charts
Trading Strategies 8 min read

How to Trade With MetaTrader Webtrader

26 Oct, 2022
a digital stock ticker display showing the phrase "DIVERSIFIED PORTFOLIO" in bold white text at the center
Trading Strategies 6 min read

How to Build a Diversified Portfolio

18 Oct, 2022
Two business professionals analyzing forex market data on a laptop, with financial charts and graphs overlaid, representing top forex forecasting techniques.
Forex 8 min read

Top Forex Forecasting Techniques

11 Oct, 2022
Digital display showing the words 'DOW JONES' with stock market tickers and red/green candlestick patterns in the background, illustrating the concept of Dow Jones.
Trading Strategies 5 min read

What is Dow Jones?

26 Sep, 2022
A trader analyzing multiple screens displaying financial charts and market data, representing the risks of overtrading and the importance of disciplined trading strategies.
Trading Strategies 8 min read

What is Overtrading (And How to Avoid it)

19 Sep, 2022
A trader's silhouette with a swirling galaxy inside the head, symbolizing the deep psychology of forex trading, with financial charts in the background.
Trading Strategies 5 min read

How to Master The Psychology of Forex Trading

06 Sep, 2022
Major Forex Market Hours and Trading Sessions — row of wall clocks displaying current times in various global cities including New York, London, Tokyo, and Hong Kong, symbolizing the 24-hour nature of forex trading across global sessions.
Forex 8 min read

Major Forex Market Hours and Trading Sessions

30 Aug, 2022
wooden blocks displaying the letters CFD, representing Contracts for Difference
CFD 4 min read

How to Choose a CFD Trading Platform

23 Aug, 2022
a trader analyzing financial charts with a stylus on a digital screen
Trading Strategies 4 min read

How to Overcome Fear When Trading

22 Aug, 2022
A close-up of a forex trading screen displaying various currency pairs like USD/JPY, EUR/JPY, and GBP/USD, with price movements in green and red, indicating market volatility.
Forex 5 min read

The Most Volatile Currency Pairs (& How to Trade Them)

08 Aug, 2022
Two professionals analyzing financial data on a laptop, illustrating the concept of Carry Trade in Forex.
Trading Strategies 6 min read

What is Carry Trade in Forex?

03 Aug, 2022
Global currencies symbols (Pound, Euro, Dollar, Yen) with a blue globe on a background featuring repeated 'News' text, representing forex news trading strategy.
Forex 5 min read

How to Trade Forex News: Forex News Trading Strategy

27 Jul, 2022
A stressed businessman in a suit looks at a laptop screen showing a declining candlestick chart, indicating a possible trading loss, illustrating why traders lose money in intraday trading.
Trading Strategies 5 min read

Why Do Traders Lose Money in Intraday Trading

19 Jul, 2022
What is Consolidation in the Stock Market? A digital stock chart displaying price movements with technical indicators, illustrating a period of market consolidation.
Forex 5 min read

What is Consolidation in the Stock Market?

12 Jul, 2022
The image displays wooden letter blocks arranged to spell "FOREX", representing the foreign exchange market.
Forex 8 min read

Forex Words and Jargons Every Trader Should Know

28 Jun, 2022
What Are Market Reversals and How to Spot Them? – Learn how to identify trend reversals using key technical indicators and price action strategies.
Trading Strategies 5 min read

What Are Market Reversals And How to Spot Them?

07 Jun, 2022
MetaTrader 4: Top Tips and Tricks — a computer screen displaying a complex trading chart with colorful indicators and candlestick patterns.
Trading Strategies 10 min read

MetaTrader 4: Top Tips and Tricks

01 Jun, 2022
Hawkish vs. Dovish: How Do They Affect the Forex Market – A visual representation of a financial market chart with a hand interacting, symbolizing market sentiment shifts influenced by central bank policies.
Forex 8 min read

Hawkish vs Dovish: How Do They Affect The Forex Market

23 May, 2022
gold bitcoin with trading chart in the background
Cryptocurrencies 5 min read

Cryptocurrency vs Forex Market: What’s The Difference?

09 May, 2022
silver bars in a blue background
Commodities 5 min read

Top Silver Trading Strategies To Get Ahead

03 May, 2022
Hands pointing at a touchscreen displaying a colorful technical trading chart with candlesticks, trendlines, support and resistance levels, illustrating the concept of the key drivers of the Forex market.
Forex 8 min read

What Are The Key Drivers of The Forex Market

25 Apr, 2022
Questions to Ask When Planning Trade Exits, illustrated by an abstract financial chart overlay with blurred business professionals in the background.
Daily Forex Analysis 5 min read

Questions to Ask When Planning Trade Exits

06 Apr, 2022
7 Popular Indices Trading Strategies, featuring a close-up of a financial chart with candlesticks and market data.
Forex 5 min read

7 Popular Indices Trading Strategies

21 Mar, 2022
Non-Farm Payrolls and Forex: Everything You Need to Know, illustrated by wooden blocks displaying the letters "NFP".
Forex 5 min read

Non-Farm Payrolls and Forex: Everything You Need to Know

14 Mar, 2022
Forex exchange rates showing a sharp decline in the Russian ruble (RUB) against major currencies, reflecting the impact of the Russia-Ukraine crisis on the forex market.
Forex 5 min read

How The Russia-Ukraine Crisis is Impacting the Forex Market

08 Mar, 2022
Golden chess pieces overlaid with financial charts, graphs, and stock market data, symbolizing strategic decision-making in CFD trading. Top CFD Trading Strategies for Beginners.
CFD 5 min read

Top CFD Trading Strategies For Beginners

01 Mar, 2022
A gold bar labeled "999.9 Fine Gold" placed on top of scattered US dollar bills, representing trading gold CFDs and key insights investors need to know.
Commodities 5 min read

Trading Gold CFDs: Here’s Everything You Need to Know

21 Feb, 2022
How to Use the USDX for Forex Trading – U.S. dollar bills with a magnifying glass overlaying forex market data, symbolizing the role of the U.S. Dollar Index (USDX) in currency trading.
Forex 5 min read

How to Use the USDX for Forex Trading

16 Feb, 2022
 A close-up of a keyboard with a prominent blue key labeled "MARGIN CALL," symbolizing the concept of margin calls in forex trading and the importance of risk management to avoid them.
Forex 6 min read

What is Margin Call in Forex (And How Do You Avoid One)

08 Feb, 2022
trading screen displaying oil and other commodities
Commodities 3 min read

How to Trade Oil CFDs

25 Jan, 2022
Digital financial display showing multiple stock market charts and index values, representing how an Index CFD works in trading.
CFD 5 min read

How Does an Index CFD Work?

13 Jan, 2022
Wooden blocks spelling 'CFD' on a dark background, representing key principles of CFD trading. Learn the 10 important rules for CFD trading.
CFD 5 min read

10 Important Rules for CFD Trading

21 Dec, 2021
Digital forex chart with candlestick patterns and numerical data on a purple background, illustrating the 15 most popular forex chart patterns.
Forex 10 min read

15 Most Popular Forex Chart Patterns

09 Dec, 2021
a businessman in a suit using a laptop, with overlaid digital charts
Forex 4 min read

How to Find Out Which Forex Broker Is Legit

24 Nov, 2021
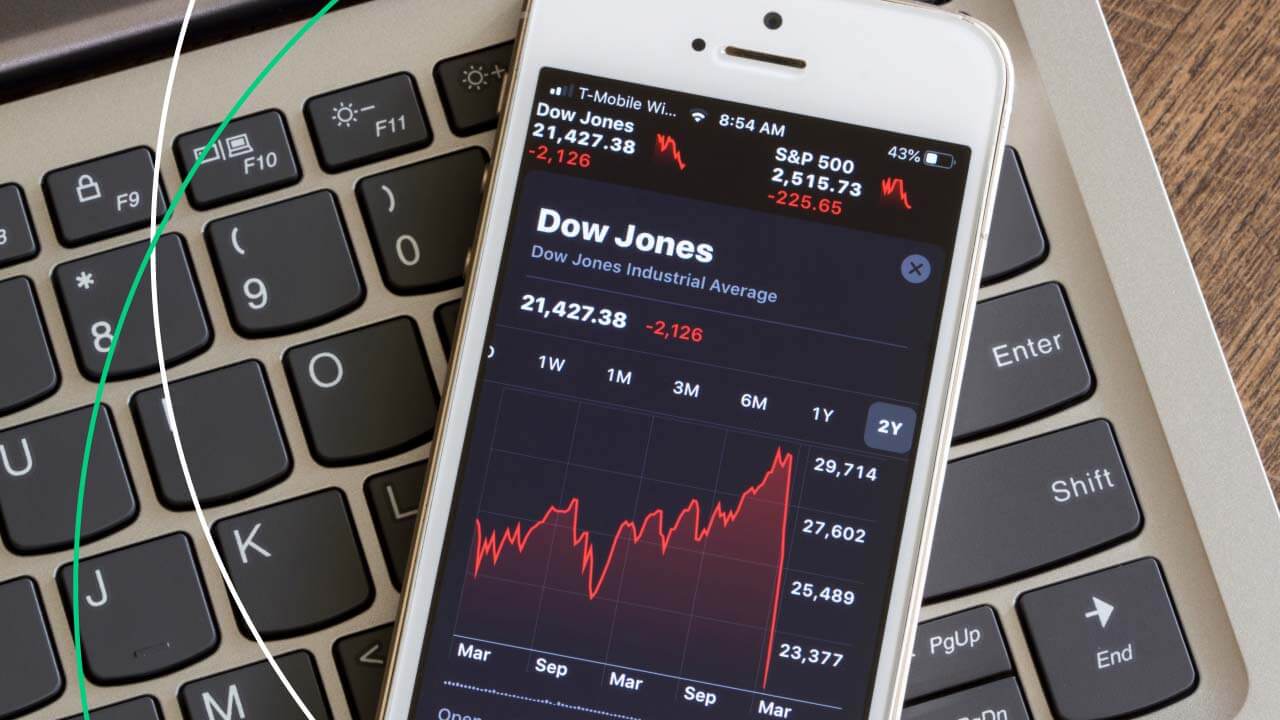
Index Trading Explained: How to Trade Indices – A smartphone displaying the Dow Jones Industrial Average chart placed on a laptop keyboard, symbolizing digital trading and market analysis.
Shares 3 min read

Index Trading Explained: How to Trade Indices

22 Nov, 2021
Silver bullion bars placed on financial charts and graphs, analyzing silver trading trends and market performance for beginner traders.
Commodities 8 min read

Silver Trading: A Beginner's Guide to Trading in Silver

18 Nov, 2021
Gold and silver cryptocurrency coins, including Bitcoin, Binance Coin, and Ethereum, placed on a digital trading screen displaying crypto market data. Top 10 Tips for Bitcoin and Crypto Trading.
Cryptocurrencies 5 min read

Top 10 Tips for Bitcoin and Crypto Trading

10 Nov, 2021
Short Selling Stocks: What does Shorting a Stock Mean?, illustrated by stocks displayed on a screen.
Shares 5 min read

Short Selling Stocks: What does Shorting a Stock Mean?

26 Oct, 2021
A trader analyzing charts and financial data on a computer screen, holding a printed report with graphs, representing 16 effective day trading strategies for beginners.
Forex 5 min read

16 Effective Day Trading Strategies for Beginners

19 Oct, 2021
Oil Trading: How to Trade Oil Spot Prices, Options, and Futures, illustrated by a digital illustration of oil barrels in front of a financial chart background.
Commodities 5 min read

Oil Trading: How to Trade Oil Spot Prices, Options, and Futures

11 Oct, 2021
Get Started with Cryptocurrency CFDs: Everything You Need to Know – Physical representations of cryptocurrencies, including Bitcoin, Ethereum, and Litecoin, placed on a digital circuit board, symbolizing cryptocurrency CFD trading.
Cryptocurrencies 5 min read

Get Started with Cryptocurrency CFDs: Everything You Need to Know

04 Oct, 2021
A graphic illustration of forex trading and its symbols, illustrating Forex 101: terms and jargon that you need to understand
Forex 8 min read

Forex 101: Terms And Jargon That You Need To Understand

01 Oct, 2021
CFDs vs Stocks: Which is a Better Investment? – A bustling trading floor at the New York Stock Exchange (NYSE), showcasing digital stock tickers, financial data screens, and traders engaged in market activities.
Shares 5 min read

CFDs vs Stocks: Which is a Better Investment?

21 Sep, 2021
Digital stock market display showing 'OIL' with a green upward arrow, symbolizing oil price movement and trading opportunities.
Commodities 2 min read

How to Start Oil Trading in 5 Simple Steps

13 Sep, 2021
Top Economic Indicators Traders Should Watch, illustrated by a tablet displaying business news on a desk with financial reports, a smartphone, a pen, and a cup of coffee.
Forex 5 min read

Top Economic Indicators Traders Should Watch

08 Sep, 2021
Forex Trading Strategies That Actually Work – A focused trader in a white shirt analyzes market charts and notes at a desk with multiple monitors displaying forex trading data, emphasizing the importance of strategic planning for successful trading.
Forex 8 min read

Forex Trading Strategies That Actually Work

31 Aug, 2021
How to Use Trailing Stop-Loss in Forex
Forex 5 min read

How to Use Trailing Stop-Loss in Forex: 3 Powerful Techniques

31 Aug, 2021
image of a barrel of oil, gold and silver bars
Commodities 8 min read

How to Trade Commodities: A Complete Guide

24 Aug, 2021
Top 5 Moving Average Trading Indicators, illustrated by a man wearing glasses analyzing financial charts on a large computer monitor in a home office setting.
Forex 8 min read

Top 5 Moving Average Trading Indicators

24 Aug, 2021
Mobile phone displaying trading Bitcoin, illustrating the concept of What is Bitcoin and How Do You Trade It.
Cryptocurrencies 5 min read

What is Bitcoin and How Do You Trade It?

20 Aug, 2021
Types of Forex Charts (And How to Read Them), illustrated by a close-up of a colorful trading chart with candlesticks, multiple moving averages, and trading volume bars on a dark blue background.
Forex 8 min read

Types of Forex Charts (And How to Read Them)

12 Aug, 2021
How to Trade Gold: Top Gold Trading Strategies and Tips – A gold trading concept featuring a dark candlestick chart with highlighted golden candlesticks symbolizing gold price movements.
Commodities 8 min read

How to Trade Gold: Top Gold Trading Strategies and Tips

11 Aug, 2021
"How To Identify A Market To Trade" in blue text on a background, illustrating the Forex Chart of the Day: how to identify a market to trade
Daily Forex Analysis 5 min read

FOREX Chart Of The Day: How To Identify A Market To Trade

11 Aug, 2021
Top 10 Trading Indicators Every Forex Trader Should Know, illustrated by a businessman using a laptop with an overlay of financial charts and cityscape buildings in the background.
Forex 8 min read

Top 10 Trading Indicators Every Forex Trader Should Know

06 Aug, 2021
a silhouetted man in a suit stands in front of a massive clock
Forex 7 min read

A Guide to Multiple Timeframe Analysis

05 Aug, 2021
A businessman in a suit touching a digital interface displaying 'CFD' in a blue circle, surrounded by currency and cryptocurrency symbols. Top Benefits of Trading CFDs.
CFD 5 min read

Top Benefits of Trading CFDs

30 Jul, 2021
gold bars stacked on a glowing digital chart background
Commodities 5 min read

How to Start Day Trading Gold

29 Jul, 2021

A Beginner's Guide to Contract for Differences (CFDs), featuring a golden bear figurine on a black keyboard with 'CFD' key.
CFD 8 min read

A Beginner's Guide to Contract for Differences (CFDs)

21 Jul, 2021
6 Forex Exit Indicators: When to Exit Your Trade and Take a Profit, illustrated with a candlestick chart and trading signals.
Forex 8 min read

6 Forex Exit Indicators: When to Exit Your Trade and Take a Profit

16 Jul, 2021
A visual representation of rising interest rates, showing stacks of coins increasing in height from left to right.
Forex 7 min read

How Interest Rates Affect Forex Trading

16 Jul, 2021
Trader analyzing financial data on multiple screens at a desk with charts, graphs, and a laptop, illustrating why forex traders need quantitative tightening.
Forex 5 min read

Why Forex Traders Need Quantitative Tightening

02 Jul, 2021
A group of three professionals, two men and one woman, discussing in an office setting, illustrating why a forex trading plan matters and how to build one.
Forex 5 min read

Why A Forex Trading Plan Matters (And How To Build One)

01 Jul, 2021
Trend Trading In Forex: How To Effectively Use This Strategy, illustrated by a candlestick chart with a green trendline showing a steady upward movement on a blue grid background.
Forex 7 min read

Trend Trading In Forex: How To Effectively Use This Strategy

25 Jun, 2021
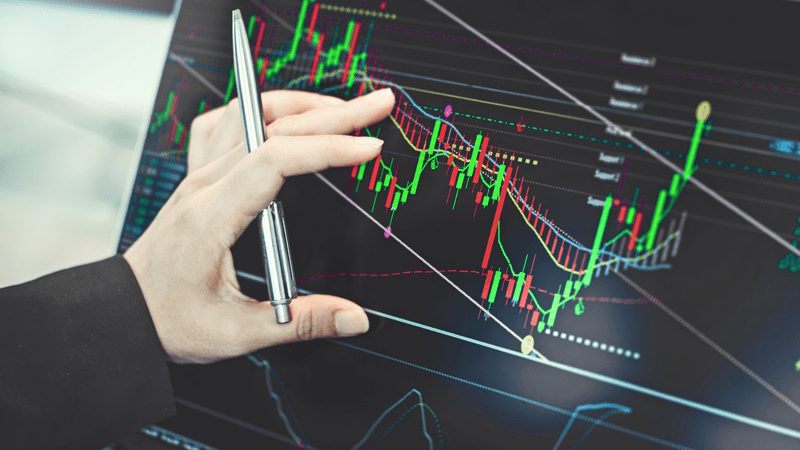
Close-up of a hand using a pen to interact with a computer screen, illustrating the concept of Algorithmic Trading.
Forex 6 min read

What Is Algorithmic Trading

11 Jun, 2021
Spoofing In Forex Trading, illustrated by a laptop displaying a "spoofing" text with green codes in the background.
Forex 5 min read

Spoofing In Forex Trading Blueberry Markets

10 Jun, 2021
Monetary And Fiscal Policies In Forex — Illustration showing two government buildings side by side, representing economic concepts.
Forex 5 min read

Monetary And Fiscal Policies In Forex

06 Jun, 2021
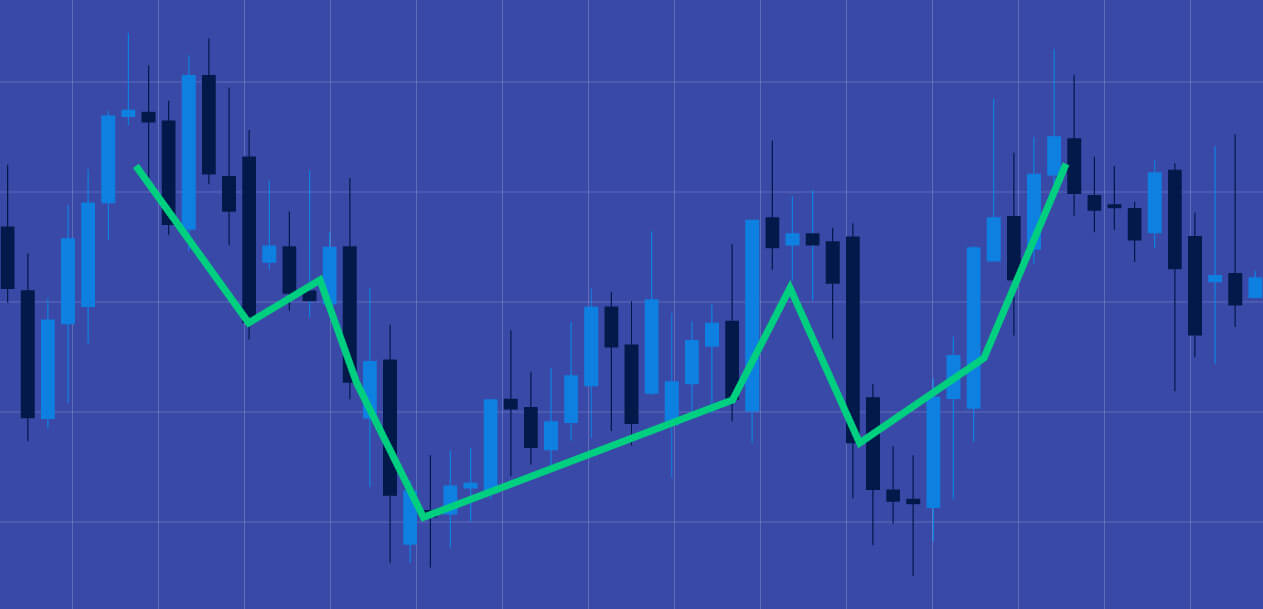
A forex candlestick chart with a highlighted zigzag pattern, illustrating double candlestick patterns for profitable trading strategies.
Forex 5 min read

How To Profit From Double Candlestick Patterns

04 Jun, 2021
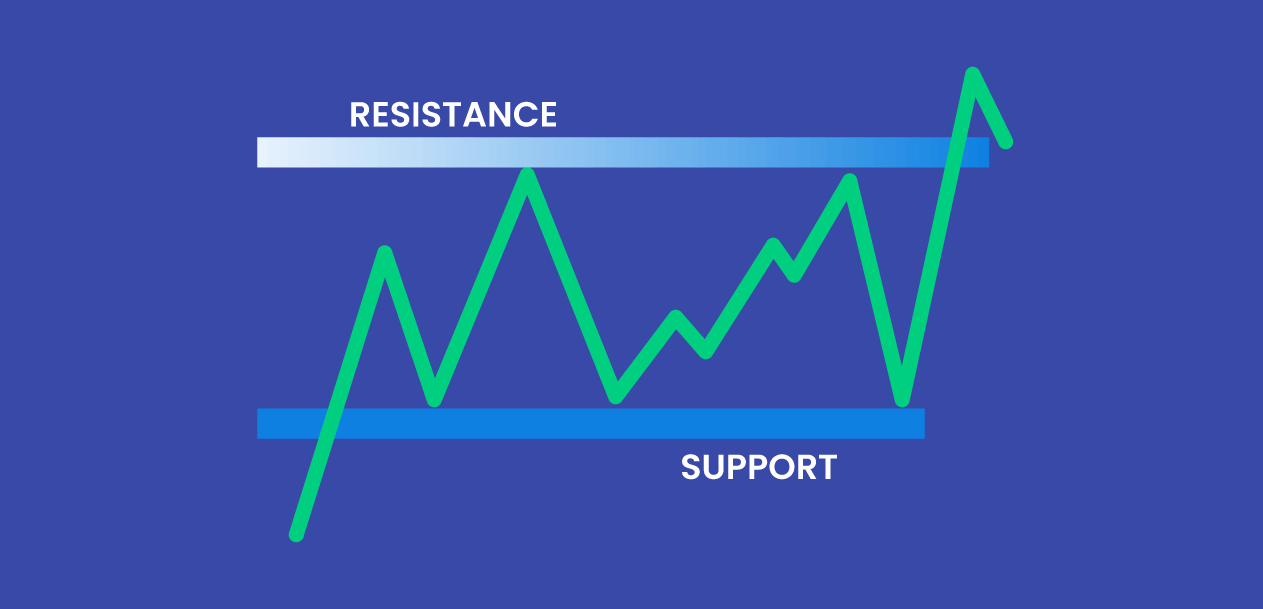
Illustration of a price chart with a green zigzag line bouncing between two horizontal bands labeled ‘Support’ at the bottom and ‘Resistance’ at the top, illustrating forex trading using support and resistance levels
Forex 3 min read

Forex Trading Using Support And Resistance Levels

21 May, 2021
different coins with buy & sell
Forex 5 min read

How to Use a VPS For Forex?

21 May, 2021
Can Bitcoin Eventually Become (Or Replace) The US Dollar As A Reserve Currency? – A stack of golden Bitcoin coins placed against a blue-toned background featuring US dollar bills, symbolizing the debate on Bitcoin's potential as a global reserve currency.
Cryptocurrencies 5 min read

Can Bitcoin Eventually Become (Or Replace) The US Dollar As A Reserve Currency?

14 May, 2021
A digital screen displaying binary options trading interface, illustrating exploring binary options trading
Forex 5 min read

Exploring Binary Options Trading

14 May, 2021
Two traders in formal business attire analyzing multiple forex trading charts on computer monitors, discussing market trends and potential strategies.
Forex 5 min read

Three Powerful Strategies You Can Use In Forex Trading

30 Apr, 2021
Binni Ong on the Past, Present, and Future of Forex: A professional woman in glasses with a financial candlestick chart overlay, symbolizing forex market insights.
Forex 5 min read

Binni Ong On The Past, Present, And Future Of Forex

28 Apr, 2021
Trading With The RSI Indicator, illustrated by a hand holding three wooden blocks spelling out 'RSI' against a dark blue background, representing the RSI trading indicator.
Forex 5 min read

Trading With The RSI Indicator

09 Apr, 2021
photo of Dean Hyde
Forex 5 min read

It's always a good time to make your money work for you

01 Apr, 2021
a hand holding a tablet displaying a forex trading platform interface
Forex 4 min read

Choosing Your Forex Broker

18 Mar, 2021
The Best Time To Trade Forex, illustrated by a man in a checkered suit looking at his watch while working on a laptop in a stylish indoor setting.
Forex 5 min read

The Best Time To Trade Forex

15 Mar, 2021
The Pip And Its Usage In Forex, illustrated by an image of a pip in an animated background.
Forex 8 min read

The Pip And Its Usage In Forex

12 Feb, 2021
The Basics Of A Fundamental Analysis, illustrated by a hand analyzing printed financial charts with a laptop and notebook nearby, overlaid with candlestick and line chart graphics.
Forex 5 min read

The Basics Of A Fundamental Analysis

11 Feb, 2021
The Basics Of Opening A Forex Account, illustrated by a person analyzing forex trading charts on a laptop with buy and sell options displayed on the screen.
Forex 5 min read

The Basics Of Opening A Forex Account

09 Feb, 2021
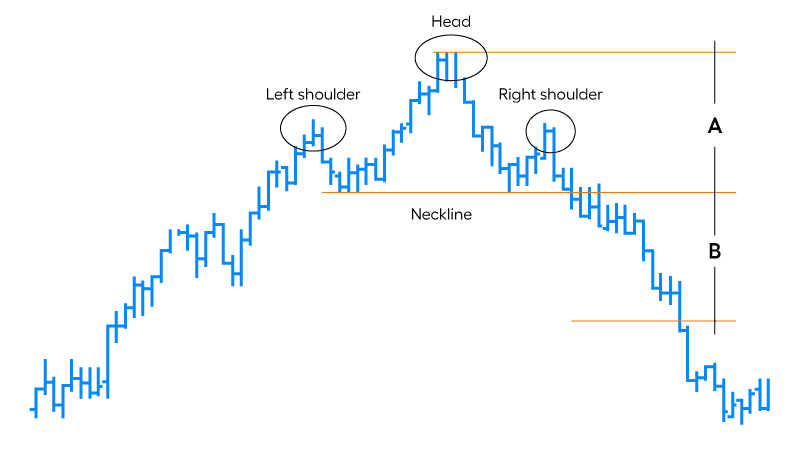
A chart illustrating the classic "Head and Shoulders" pattern used in technical analysis.
Forex 5 min read

How To Trade With The Head And Shoulders Pattern

05 Feb, 2021
Illustration representing the Foreign Exchange (FX) Market with large orange 'FX' letters and people interacting around them, illustrating forex: its history and futures
Forex 8 min read

Forex: Its History And Futures

03 Feb, 2021
The Basics Of Swing Trading, illustrated by a person swinging along a rising dotted line graph representing market movements and swing trading.
Forex 5 min read

The Basics Of Swing Trading

25 Jan, 2021
Image showing "What You Need to Know" in blue text, illustrating Forex 101: what you need to know before placing your first trade
Forex 8 min read

Forex 101: What You Need To Know Before Placing Your First Trade

20 Jan, 2021
A business professional presenting a strategy on a whiteboard with charts, illustrating Forex 101: how to make a forex trading plan
Forex 8 min read

Forex 101: How To Make A Forex Trading Plan

12 Jan, 2021
Traders analyzing divergence patterns on a financial chart, illustrating divergence trading and how to navigate around it
Trading Strategies 8 min read

Divergence Trading and How to Navigate Around It

29 Dec, 2020
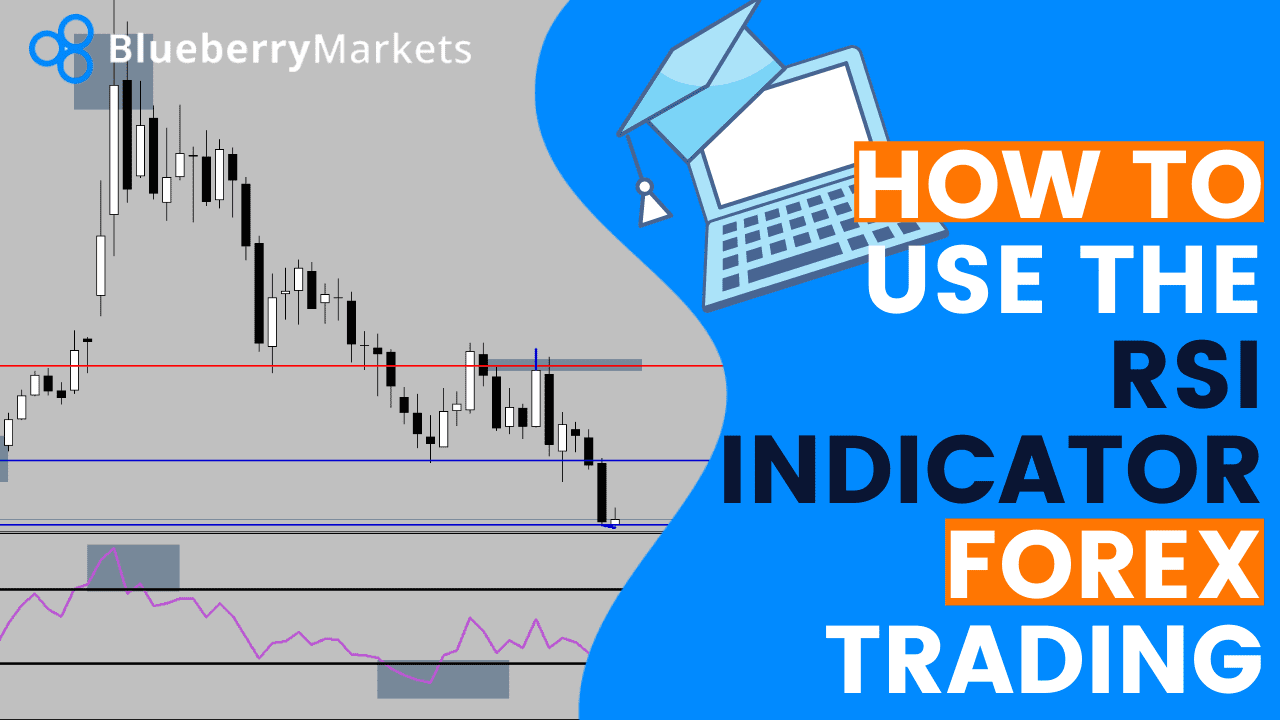
How To Use The RSI Indicator Forex Trading
Daily Forex Analysis 6 min read

How To Use The RSI Indicator Forex Trading

09 Dec, 2020
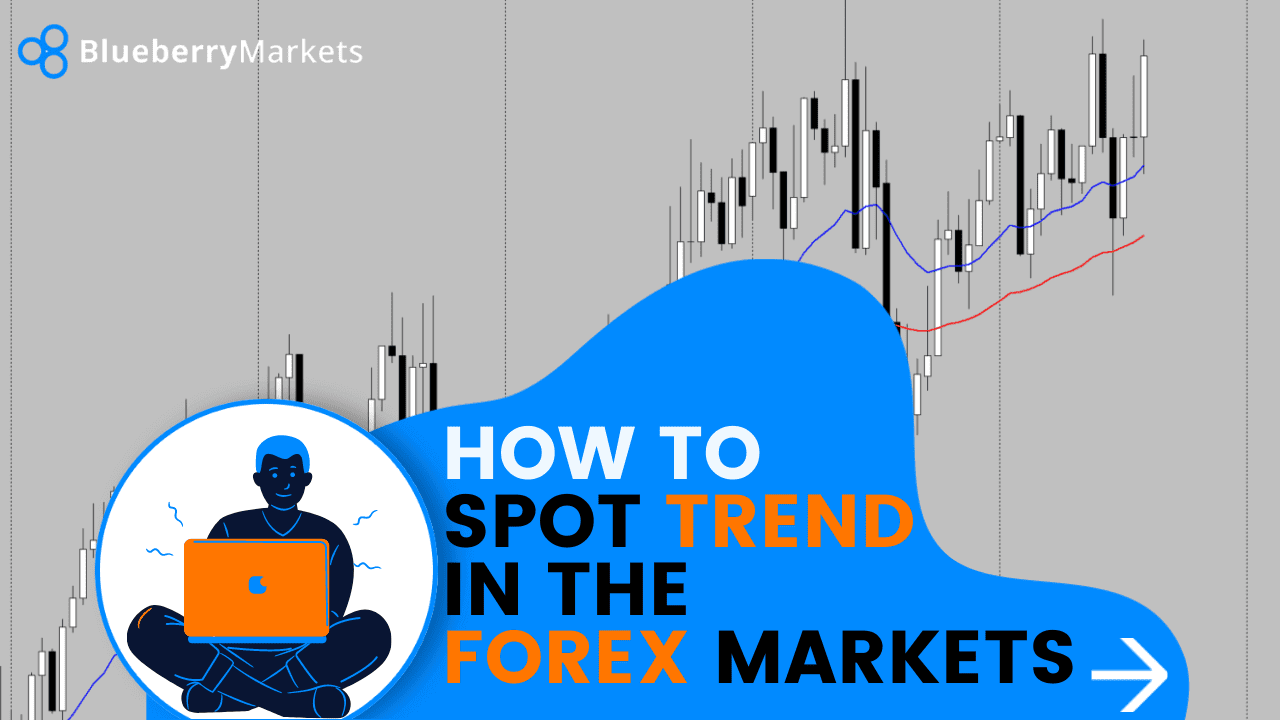
How To Spot Trend In The FOREX Market
Daily Forex Analysis 5 min read

How To Spot Trend In The FOREX Market

03 Dec, 2020
Trading with the Head and Shoulders Pattern displayed on a laptop screen, illustrating a technical analysis chart with labeled peaks and trendlines.
Trading Strategies 5 min read

Trading with the Head and Shoulders Pattern

06 Oct, 2020
Pivot Points and Why They Matter, illustrated by a trader analyzing pivot points, resistance, and other indicators on a screen.
Trading Strategies 5 min read

Pivot Points and Why They Matter

02 Oct, 2020
A retail trader in a white shirt analyzing multiple financial charts on six monitors, tracking market trends and price movements in a trading setup.
Trading Strategies 5 min read

The Key to Making It as a Retail Trader

12 Sep, 2019
The Nitty-Gritty of Risk Management, illustrated by a close-up view of a digital screen displaying financial data and numerical values in rows and columns.
Trading Strategies 8 min read

The Nitty-Gritty of Risk Management

12 Sep, 2019