

Curious about Bitcoin's next move? 🚀📉 Explore the future of cryptocurrency in our latest video, 'Where is Bitcoin Heading Now?' Join us as we analyze current trends and predict what's next for this digital currency. #BitcoinForecast #trading #Bitcoin
Watch the video to learn more...
Where is the Bitcoin Price Heading Now?
Bitcoin, the trailblazer of cryptocurrencies, recently hit a peak of $48,000, generating buzz and excitement in the crypto community. However, the landscape of digital currencies is ever-evolving, and with it, the direction of Bitcoin's value.
A significant development occurred on January 11th when a dozen Exchange Traded Funds (ETFs) from heavyweight investment firms like BlackRock and Fidelity made their entrance into the trading arena. This move was anticipated to be a game-changer, potentially igniting a new wave of investments into Bitcoin.
The rationale was straightforward: ETFs would provide a more accessible route for traditional investors to tap into the Bitcoin market, diversifying their portfolios without directly purchasing the cryptocurrency. This could, in theory, lead to an increased demand for Bitcoin, pushing its price further up.
Initially, it seemed the predictions were spot on. Bitcoin's value rallied, perhaps in response to this new, institutional vote of confidence. However, the cryptocurrency market is known for its volatility, and the initial enthusiasm has since dimmed. The anticipated sustained surge in Bitcoin's value didn't materialize as expected.
Now, investors and enthusiasts alike are keenly watching the market, speculating on Bitcoin's next move. Based on current trends and market analyses, there's a consensus that Bitcoin might find its next support level between $38,000 to $40,000. This support range is critical; it's a threshold that could either reinforce confidence in the currency's stability or, if broken, could lead to a reevaluation of Bitcoin's short-term value.
BITCOIN
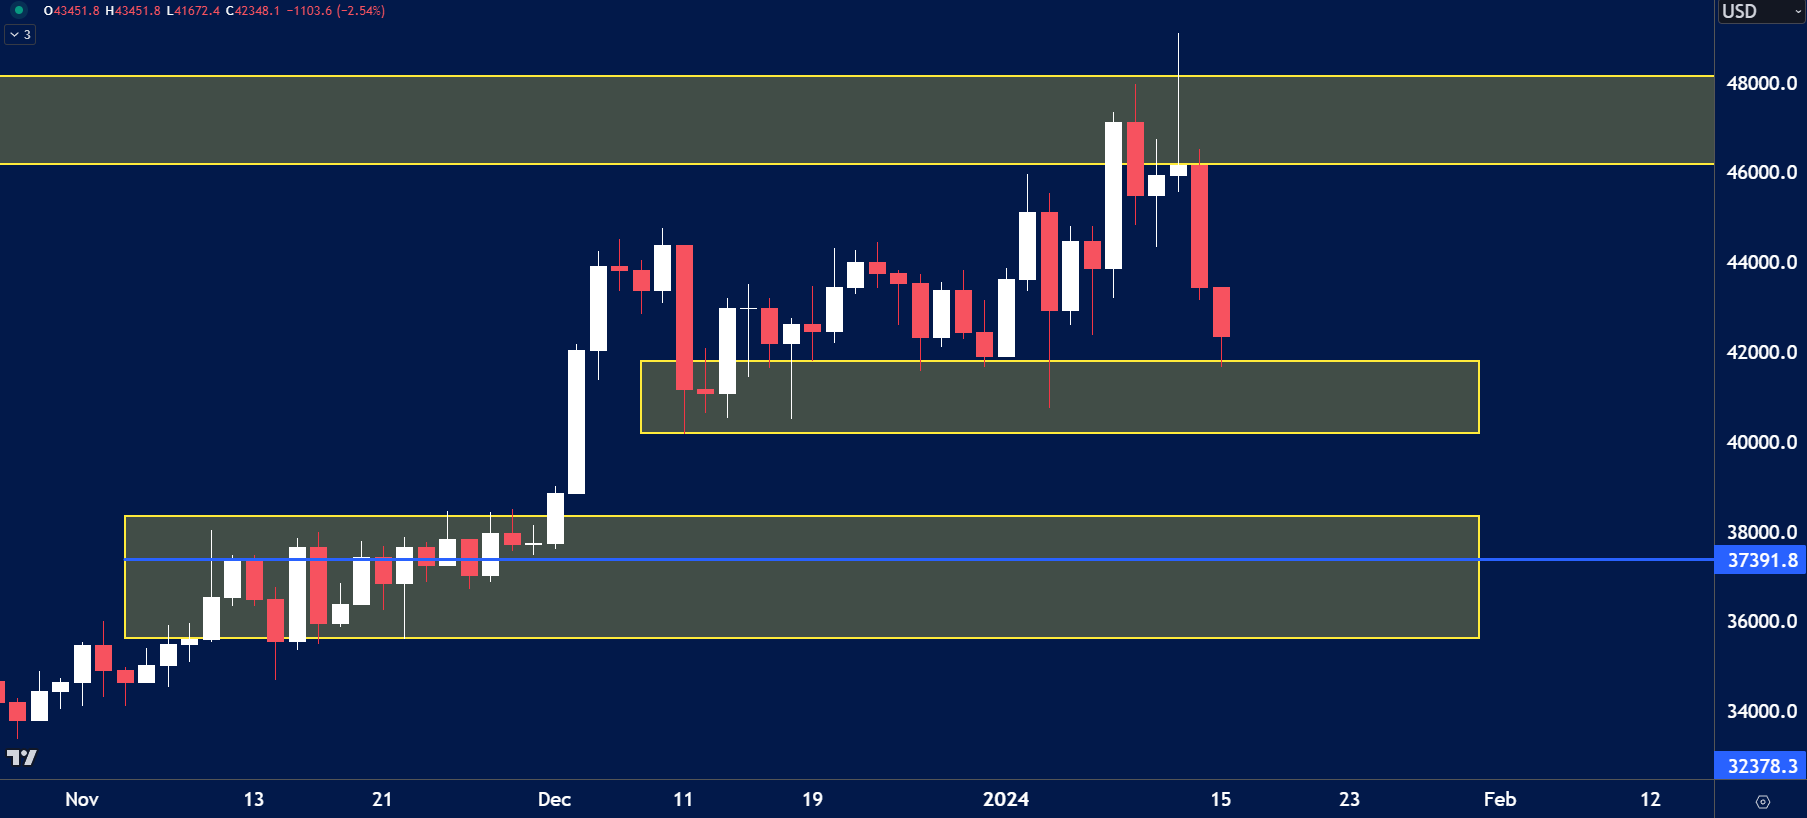
The price on the chart has traded through multiple technical levels and some observations included:
- Price found resistance at $48k.
- Now the price is trading at support of $42k.
- This could be an ideal level for buyers looking to get into Bitcoin.
Have you watched our latest video update? You can see it here.
Enjoy low spreads and quick trade executions with a live account. Our highly committed customer support team will assist you with your quick account setup for any future concerns. Start trading with Blueberry.
Disclaimer: All material published on our website is intended for informational purposes only and should not be considered personal advice or recommendation. As margin FX/CFDs are highly leveraged products, your gains and losses are magnified, and you could lose substantially more than your initial deposit. Investing in margin FX/CFDs does not give you any entitlements or rights to the underlying assets (e.g. the right to receive dividend payments). CFDs carry a high risk of investment loss.